

Loading…
Loading…
Loading…
Eduqas GCSE Geography A · C111
Eduqas C111 · Cartographic Skills Check the specification (PDF) (opens in a new tab)
A map selects information about places and shows how that information is arranged. Location tells us where something is; distribution tells us how it is spread across an area. A spatial pattern is an arrangement within that distribution: features might cluster together, follow a coastline, form a line or become less common away from a centre.
Begin with the title to establish what is mapped. Then read the key, units, date, orientation and scale. A colour might represent height, population density or a category of land use: its meaning comes from the key, not from the colour alone.
When describing a distribution, move from the overall pattern to supporting detail. Identify where values or features are concentrated, use directions and named places, and mention exceptions. Interpretation takes this further by considering what the pattern means and suggesting explanations supported by the available evidence.
An atlas contains maps of places and themes, such as relief, population or climate. Physical maps show natural features; political maps show boundaries and places; thematic maps focus on a particular variable. Comparing maps of the same area can reveal relationships between human and physical geography.
A small-scale map covers a large area with less detail. A large-scale map covers a smaller area in greater detail. At , the map has a larger scale than at , because the ground has been reduced less. Both are scales used for Ordnance Survey maps.
A world atlas map is useful for identifying broad concentrations or contrasts between regions. A more detailed regional map can reveal differences hidden within those regions. When moving between scales, check whether the key and the units remain the same: two maps with similar colours may represent different categories.
For example, suppose a national population map shows one region as densely populated. A local map might reveal that most people live in a few settlements, with sparsely populated land between them. The local pattern adds detail rather than necessarily contradicting the national pattern.
A topological map emphasises how places are connected. A transport-network diagram, for example, helps you follow a route through linked stops and identify where to change services. Lines and spacing may be simplified, so the diagram is not necessarily suitable for measuring ground distances or judging exact compass directions.
Harry Beck’s London Underground diagram, first published in 1933, is a useful example. Beck used horizontal, vertical and 45-degree lines instead of following the true paths of the tunnels. He also enlarged central London to make its closely packed stations easier to read. This distortion made connections and interchanges clearer: the diagram prioritised planning a railway journey over accurately representing the geography above ground.
To interpret a topological map, read the key to identify routes and interchange symbols. Trace the connections from the starting point to the destination, checking the order of stops and where routes meet. A crossing of lines is only a place to change services if the map indicates an interchange.
For example, suppose one route links stops A–B–C, and another links C–D–E, with C marked as an interchange. To travel from A to E, follow the first route through B to C, change there, then follow the second through D to E. The connections establish a possible journey, but the diagram’s line lengths do not establish its distance or duration. A route with fewer stops is not automatically shorter in kilometres or quicker to travel.
An isoline joins places with the same value. Contours join equal heights, while rainfall isolines join equal rainfall amounts. Read the line labels and units before deciding which direction values increase.
Suppose successive rainfall lines are labelled 2, 4 and 6 mm, with the 6 mm line inside the others. This indicates rainfall increasing towards the centre. A point between the 4 and 6 mm lines has a value within that range, rather than necessarily exactly 5 mm. If equal-value intervals are closer together, the mapped value changes more rapidly over distance.
A rainfall map also needs a time period: 6 mm in twelve hours is different information from 6 mm over a month. Comparing rainfall collected in gauges with a land-use layer may suggest explanations for differences. Trees can intercept rain, affecting how much reaches a gauge beneath them. That possibility would need checking against gauge positions and other evidence.
A synoptic chart summarises weather conditions across an area at a particular time. Isobars join places with equal atmospheric pressure. Closely spaced isobars indicate stronger winds; widely spaced isobars suggest lighter winds.
Around high-pressure systems, air circulates clockwise in the Northern Hemisphere; around low-pressure systems it circulates anticlockwise. Use this alongside isobar spacing to interpret the broad wind pattern.
Fronts mark boundaries between air masses. A warm front is shown by semicircles, usually on a red line; a cold front has triangles, usually on a blue line. These symbols point in the direction the front is moving. Warm air follows a warm front, and cold air follows a cold front. Both commonly bring increased cloud and rainfall.
An occluded front forms when a cold front overtakes a warm front. It is shown by alternating triangles and semicircles, usually on a purple line. A trough is shown by a plain black line and is often associated with showers; it is not the same as a front.
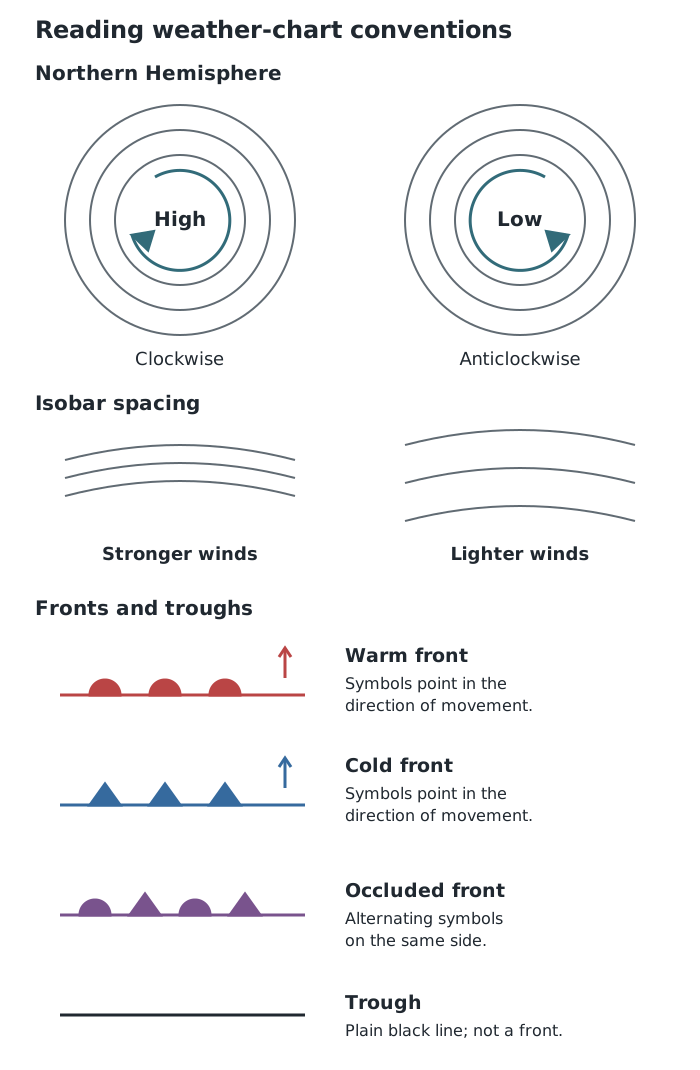
Use isobar spacing to assess wind strength and front symbols to identify boundaries and their movement.
To interpret conditions at a place, locate it relative to the pressure systems and fronts. A place near an approaching front may experience increasing cloud and rain; close isobars also suggest strong winds. Check the chart’s time before treating it as evidence about current conditions, and use cautious language because the chart does not specify every local weather detail.
A proportional-symbol map places differently sized symbols on a base map. Larger symbols represent larger quantities according to the key. This allows you to compare both the values and their locations.
First identify what the symbol measures and its units. Then compare each symbol with the key. For example, suppose a map of visitor numbers has symbols representing 100, 200 and 400 visitors. A symbol matching the 400-visitor key represents twice as many visitors as one matching the 200-visitor key. Do not assume that doubling a circle’s diameter doubles its value.
Describe where the largest and smallest symbols occur, whether large values cluster together, and whether any location differs from its neighbours. A large symbol represents a large mapped value, not necessarily a large geographical area. Overlapping symbols can also make individual locations harder to distinguish.
A Geographical Information System, or GIS, links data to locations. It can display layers on a base map, allowing different information about the same area to be compared. Layers might show settlements, roads, population or flood hazard.
A GIS screenshot is a selected view. Read its title, legend, scale, date and visible layers before interpreting it. Shaded areas may form a choropleth map, while symbols may represent individual sites or quantities. On a choropleth map, shading represents the value for a defined area; it does not reveal every difference within that area.
Suppose a town is divided into four districts. A population layer shows the two western districts as more densely populated than the eastern districts. A second layer shows a narrow flood-hazard band following a river through both the north-western and south-eastern districts. This lets you distinguish two patterns: population is concentrated in the west, while mapped flood hazard follows the river.
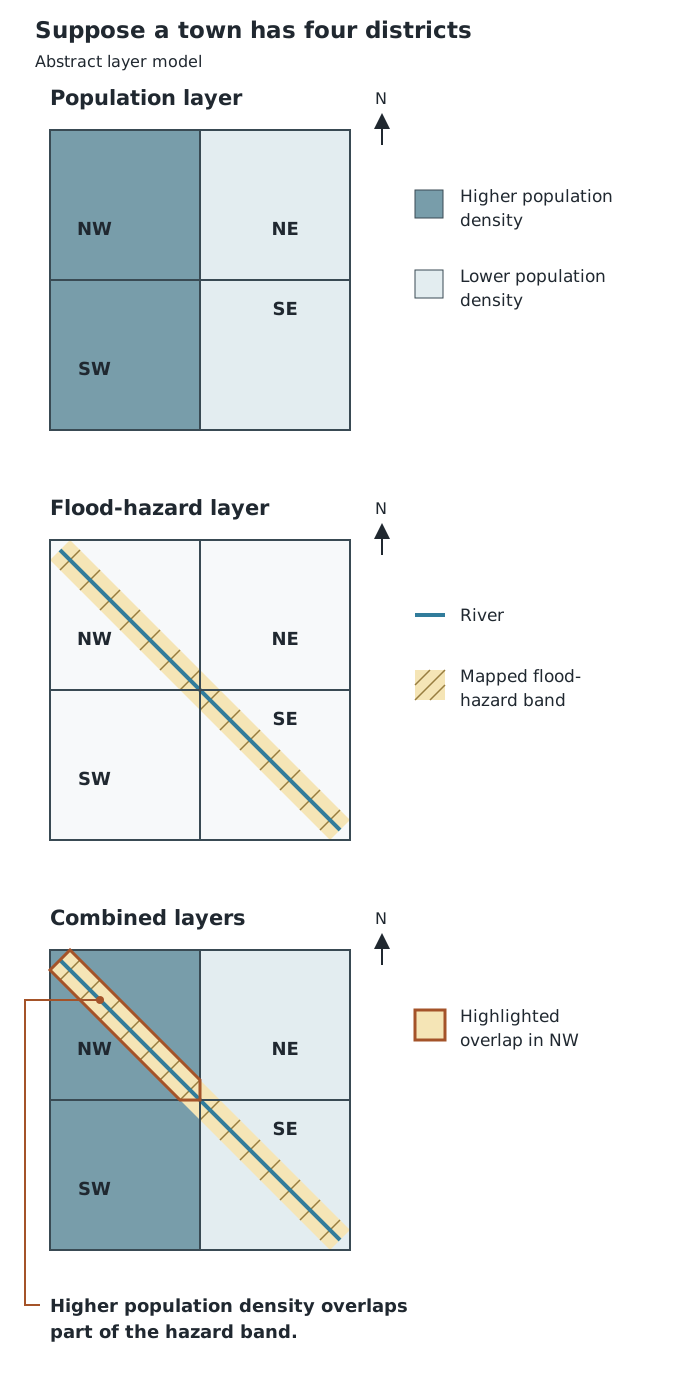
Comparing layers reveals where patterns overlap, but district-wide data cannot locate every person or building.
Overlaying the layers identifies the north-western district as containing both higher population density and part of the hazard band. It does not establish that everyone in that district lives inside the band. A more detailed layer showing individual buildings would help identify the overlap more precisely.
Use the same reasoning on an authentic GIS screenshot: describe each layer’s pattern, compare their locations, identify overlaps and exceptions, then explain what can reasonably be concluded. Check whether the datasets cover the same dates and use comparable units. A flood-hazard layer indicates mapped potential exposure, not proof that flooding is happening at the time of viewing.
Read the title, key, units, date and scale before describing a map. Darker shading does not always mean a higher value.
Describe a general spatial pattern, support it with specific locations or values, then identify any exceptions.
On proportional-symbol maps, use the symbol key rather than estimating values from a circle’s diameter.
Distinguish observation from explanation: a mapped association can suggest a cause, but does not prove it.
On weather charts, front symbols show the direction of movement; isobar spacing indicates wind strength.
It can see this note and what your specification asks for.
Answers are free with an account.
1 free note left this week
Get more free notesYour answer sets when this note comes back for review, or marks it complete.
Was this note helpful?
Log in to tell us whether it helped, or to report a problem.
Last updated
Distribution
The way a feature or quantity is spread across an area.
Spatial pattern
A geographical arrangement, such as clustering, a line of features or a change from the centre towards the edge.
Map scale
The relationship between a distance on a map and the corresponding distance on the ground.
Topological map
A map that emphasises connections between places rather than their exact distances, directions or shapes.
Isoline
A line on a map joining places with the same value of a variable.
Isobar
A line on a weather chart joining places with equal atmospheric pressure.
Synoptic chart
A map summarising atmospheric conditions across an area at a particular time.
Weather front
A boundary between air masses with different characteristics, such as temperature.
Proportional-symbol map
A map using symbols whose sizes represent quantities at particular locations.
Choropleth map
A map using different colours or shades within defined areas to represent values or categories.
Geographical Information System
A digital system that stores, displays and analyses information linked to geographical locations, often using map layers.
Put your knowledge into practice — try past paper questions for Geography A
Distribution
The way a feature or quantity is spread across an area.
Spatial pattern
A geographical arrangement, such as clustering, a line of features or a change from the centre towards the edge.
Map scale
The relationship between a distance on a map and the corresponding distance on the ground.
Topological map
A map that emphasises connections between places rather than their exact distances, directions or shapes.
Isoline
A line on a map joining places with the same value of a variable.
Isobar
A line on a weather chart joining places with equal atmospheric pressure.
Synoptic chart
A map summarising atmospheric conditions across an area at a particular time.
Weather front
A boundary between air masses with different characteristics, such as temperature.
Proportional-symbol map
A map using symbols whose sizes represent quantities at particular locations.
Choropleth map
A map using different colours or shades within defined areas to represent values or categories.
Geographical Information System
A digital system that stores, displays and analyses information linked to geographical locations, often using map layers.