

Loading…
Loading…
Loading…
Eduqas GCSE Geography A · C111
Eduqas C111 · Cartographic Skills Check the specification (PDF) (opens in a new tab)
A topographical map represents both features on the ground and the shape of the land. Its key explains symbols, its grid helps locate places, and its scale links map measurements to real distances. These work together: you might locate a footpath, measure its length and then use heights to judge how steep the journey will be.
Ordnance Survey (OS) maps at 1:25,000 and 1:50,000 use the same basic measurement principles, but show the ground at different scales. Always read the particular map’s key, scale and height information rather than assuming that every map is identical.
The numbered vertical grid lines are eastings: their numbers increase towards the east. The horizontal lines are northings: their numbers increase towards the north. Read eastings first, then northings — across the map, then up it.
A four-figure grid reference identifies a whole square. Find the easting along its left edge and the northing along its bottom edge. A square between eastings 17 and 18 and northings 51 and 52 has the reference 1751.
A six-figure grid reference identifies a position within that square. Imagine dividing the square into tenths across and tenths upwards. Add a third digit to the easting for the distance across, then a third digit to the northing for the distance up. A point five tenths across and two tenths up in square 1751 is 175512: easting 175 followed by northing 512.
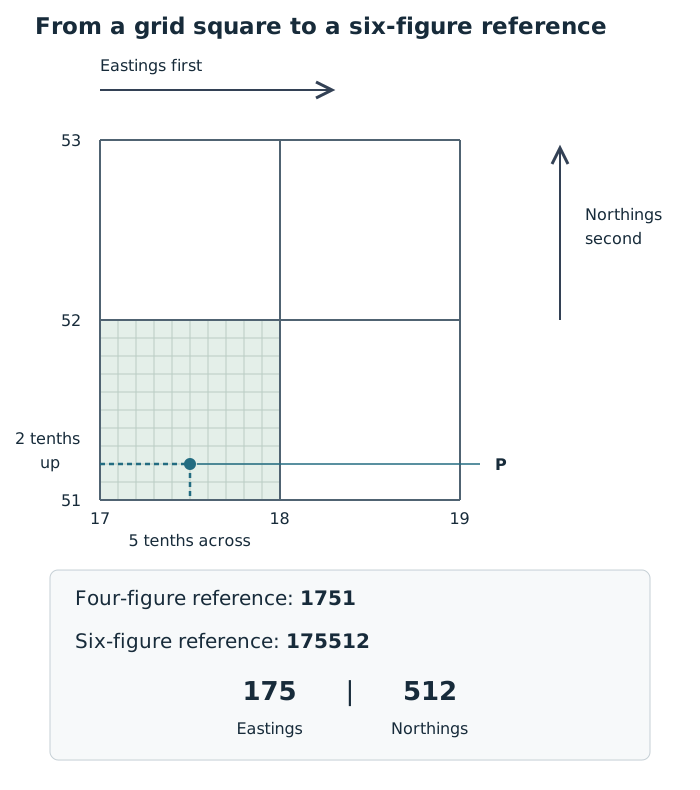
A four-figure reference identifies a square; a six-figure reference identifies a more precise position within it.
This method transfers directly to an OS extract: use the printed grid numbers, find the containing square and estimate the point’s position within it. The diagram demonstrates the method rather than locating a real place.
A ratio scale compares distances in the same units. At 1:25,000, one centimetre on the map represents 25,000 centimetres on the ground, or 250 m. At 1:50,000, one centimetre represents 500 m.
For a straight distance, measure between the two points with a ruler and multiply by the ground distance represented by one centimetre. For example, a map distance of 6 cm at 1:50,000 represents m, or 3 km.
A curved route needs a different approach. Divide it into short, nearly straight sections. Mark successive sections along the edge of a piece of paper, pivoting the paper at each bend, then measure the total marked length. Convert that total using the map scale. Shorter sections follow tight bends more accurately; measuring straight between the endpoints would miss those bends and underestimate the route length.
A scale bar provides another way to convert the measurement: compare your marked paper with the bar. Unlike a printed ratio used with a ruler, a scale bar remains useful when the whole map and its bar have been enlarged or reduced together.
Area measures how much ground a feature covers, rather than how long it is. For a rectangular feature, convert both map dimensions into ground distances before multiplying.
Suppose a rectangle is 4 cm long and 2 cm wide on a 1:25,000 map. Its ground dimensions are m and m. Its area is therefore , or .
For an irregular area, divide it into approximate rectangles and triangles and add their areas. Use for a rectangle and for a triangle, with the triangle’s height measured perpendicular to its base.
You can also estimate area using the map grid. A complete 1 km by 1 km OS grid square represents 1 km². Count complete squares inside the boundary, then combine partly covered squares into approximate whole squares. The result is an estimate because the boundary rarely follows the grid exactly.
Relief is the shape of the land, including its heights and slopes. A spot height gives the height of one particular point above sea level. A contour joins points at the same height, so every point along a contour labelled 100 m is 100 m above sea level.
The contour interval is the height difference between neighbouring contours. With a 10 m interval, moving uphill from a 100 m contour crosses 110 m, then 120 m. Check the interval on the map: it is a vertical height difference, not the distance between lines on the page.
Gradient means steepness. Closely spaced contours show a large height change over a short horizontal distance, so the slope is steep. Widely spaced contours show a more gradual change, so the slope is gentle. Compare spacing only after checking the map scale and contour interval.
Closed contours with heights increasing towards the centre indicate a hill. Contours bending into a V shape can show a valley; the point of the V faces towards higher ground. Read the height labels as well as the shapes to establish which way the land rises.
Contours are one type of isoline. On another isoline map, first identify what the lines measure and their interval. Close spacing indicates a rapid change in that mapped quantity over distance, but only height contours describe the slope of the land.
A relief cross-section shows the landscape from the side along a selected line, often labelled A–B on a map. Its horizontal axis shows distance along that line and its vertical axis shows height.
To connect a map to its cross-section, follow A–B and note where it crosses each contour. Mark those crossings and their heights on a strip of paper. Transfer their distances to the cross-section’s horizontal axis, plot each height and join the points to show the land profile.
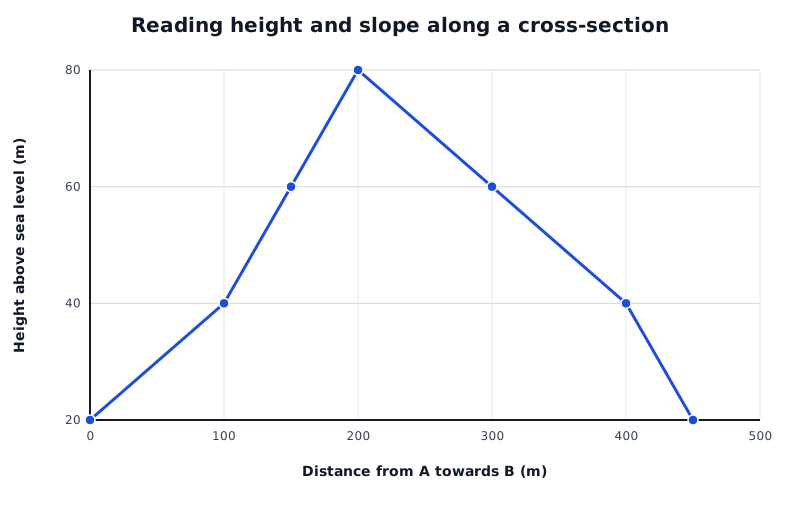
A constructed A–B land profile. Compare height change over horizontal distance rather than relying only on how steep the line looks.
Data for Reading height and slope along a cross-section
| Series | Distance from A towards B (m) | Height above sea level (m) |
|---|---|---|
| Land height from A to B | 0 | 20 |
| Land height from A to B | 100 | 40 |
| Land height from A to B | 150 | 60 |
| Land height from A to B | 200 | 80 |
| Land height from A to B | 300 | 60 |
| Land height from A to B | 400 | 40 |
| Land height from A to B | 450 | 20 |
In this constructed profile, the land rises from 20 m at A to an 80 m summit, then falls to 20 m at B. The rise from 40 m to 60 m on the left takes 50 m horizontally, whereas the fall from 60 m to 40 m on the right takes 100 m. The left-hand section is therefore steeper. On a contour map with the same contour interval, those contours would be closer together on the left.
When reading any cross-section, identify its high and low points, describe where the land rises or falls and compare slopes using height change and horizontal distance. Check both axes: an enlarged vertical scale can make slopes look steeper than they really are.
A transect follows a line across an area, but it can record more than land height. A relief cross-section concentrates on land shape; a transect can show how vegetation, soil conditions or other measurements change along the same route. Start by identifying its direction, distance scale, key and the units of each measurement.
A sand-dune transect can run inland from the strand line, the line of debris left at the top of the beach, through embryo dunes, mobile dunes, fixed dunes and into dune slacks, the low areas between dunes. The labelled zones identify different parts of the dune environment. A route roughly at right angles to the beach crosses these zones; a route parallel to the beach may remain within one zone and miss the inland changes.
Read the zone boundaries against the distance scale, then compare them with the recorded variables. These might include land height, percentage vegetation cover, wind speed, soil moisture and soil pH. Measurements aligned at the same distance let you compare conditions at the same place. A zone boundary need not coincide with a sudden change in every variable.
For example, suppose a teaching transect marks mobile dunes from 20–60 m inland and fixed dunes from 60–120 m. Vegetation cover is 15% at 40 m and 65% at 80 m. These observations show greater cover at the sampled point in the fixed dunes than at the sampled point in the mobile dunes. They do not show exactly where the increase occurred: more closely spaced measurements around 60 m would help establish whether it was gradual or sudden.
The start, end and spacing of observations affect what can be concluded. A transect ending in the fixed dunes cannot reveal conditions in the dune slacks. Widely spaced samples may miss a narrow zone or a rapid change. At Ynyslas, near Borth on the Ceredigion coast, wardens favour prescribed transect routes to protect sensitive areas, so environmental protection can restrict which parts of the dunes are sampled.
Across a footpath, a transect can combine the path’s cross-profile with vegetation or bare-ground cover. Read across the path rather than along it: locate both edges, identify any central depression or gullies, and compare the surface with the ground on either side.
A path profile may show distances measured downwards from a level reference line rather than heights above sea level. In that case, a larger recorded distance means a lower surface. Suppose the ground at each path edge is 5 cm below the reference line, while the centre is 20 cm below it. The centre is therefore 15 cm lower than the edges. If the edges lie at 1 m and 3 m along the transect, the path is 2 m wide at that crossing.
If vegetation cover is also lower in the central depression than at the edges, the measurements show that lower ground and reduced cover occur together. This is consistent with disturbance along the path, but the profile alone does not establish how much erosion has occurred over time or prove that trampling caused all of it. Repeated profiles or additional evidence about path use would strengthen that interpretation.
These methods transfer to unfamiliar transects: establish what was recorded, locate changes using the distance scale, compare measurements at matching positions and distinguish the observed pattern from its possible explanation.
Give eastings before northings. For a four-figure reference, use the grid lines at the bottom-left corner of the square.
A six-figure reference locates a point more precisely; it does not mean counting six grid lines.
Check the map scale before converting a measurement. A resized digital map may make centimetre measurements unreliable, so use its scale bar.
Measure along a road or river when asked for route distance, rather than measuring straight between its endpoints.
Give area in square units. Convert lengths to ground distances before multiplying them.
Check contour intervals and cross-section axis scales before comparing slopes.
When interpreting a transect, describe the recorded changes using distances and values before suggesting causes. A relationship between two measurements does not by itself prove causation.
It can see this note and what your specification asks for.
Answers are free with an account.
1 free note left this week
Get more free notesYour answer sets when this note comes back for review, or marks it complete.
Was this note helpful?
Log in to tell us whether it helped, or to report a problem.
Last updated
Relief
The shape of the land surface, including its heights and slopes.
Isoline
A line on a map joining places with the same value, such as height or air pressure.
Contour
A line on a map joining points at the same height above sea level.
Contour interval
The difference in height between neighbouring contour lines.
Spot height
The height above sea level of a particular point, marked on a map.
Gradient
The steepness of a slope: how much height changes over a horizontal distance.
Grid reference
A numerical reference identifying a grid square or a more precise position within it, with eastings given before northings.
Scale
The relationship between a distance on a map and the corresponding distance on the ground.
Relief cross-section
A side-on view showing the shape of the land along a selected line.
Transect
A line across an area along which features or environmental measurements are recorded to investigate changes from place to place.
Put your knowledge into practice — try past paper questions for Geography A
Relief
The shape of the land surface, including its heights and slopes.
Isoline
A line on a map joining places with the same value, such as height or air pressure.
Contour
A line on a map joining points at the same height above sea level.
Contour interval
The difference in height between neighbouring contour lines.
Spot height
The height above sea level of a particular point, marked on a map.
Gradient
The steepness of a slope: how much height changes over a horizontal distance.
Grid reference
A numerical reference identifying a grid square or a more precise position within it, with eastings given before northings.
Scale
The relationship between a distance on a map and the corresponding distance on the ground.
Relief cross-section
A side-on view showing the shape of the land along a selected line.
Transect
A line across an area along which features or environmental measurements are recorded to investigate changes from place to place.