

Loading…
Loading…
Loading…
AQA GCSE Statistics · 8382
AQA 8382 · 3.3.3 Constructing and Interpreting Charts and Graphs Check the specification (PDF) (opens in a new tab)
A graph makes patterns in a data set easier to see, but the type of graph must suit the data. Categories such as travel methods can be compared using bars. Measurements recorded over time can be shown as a time series. Paired measurements, such as temperature and sales on the same day, can be shown on a scatter chart.
Before drawing, identify what each value represents. You may need to count observations to obtain frequencies, add components to obtain totals, or calculate percentages. Give the graph a clear title, label its axes and include units where appropriate. Numerical scales should use equal distances for equal increases in value.
A bar chart uses the heights of separate bars to represent frequencies or other stated quantities. It is suitable for categorical data and discrete numerical data. The bars have equal widths and gaps between them; the widths do not represent the values.
Suppose two classes record how their pupils travel to school:
| Travel method | Class A | Class B |
|---|---|---|
| Walk | 20 | 30 |
| Bus | 10 | 10 |
| Cycle | 10 | 10 |
| Total | 40 | 50 |
To draw a bar chart for Class A, put the travel methods on the horizontal axis and frequency, in pupils, on the vertical axis. An evenly spaced scale from 0 to 20 would fit the data. Draw bars with heights 20, 10 and 10.
The tallest bar identifies the most common category: walking. Adding the frequencies gives the class total. When comparing bars, state the difference in context: Class A has 10 more walkers than cyclists.
A dual bar chart places two bars side by side for each category. For the travel table, each category would have one bar for Class A and one for Class B. A key identifies the classes, and both use the same frequency scale.
This arrangement makes category-by-category comparisons easy. Class B has 10 more walkers than Class A, while the numbers travelling by bus and cycling are equal.
A multiple bar chart extends this arrangement to more than two data sets. Adding a third class gives three bars in each category. Keep the order of the classes consistent within every group and use a clear key.
A composite bar chart, also called a stacked bar chart, puts the components of a total into one bar. For Class A, stack sections of heights 20, 10 and 10, giving a total height of 40. For Class B, the total height is 50.
Read a section’s size from the difference between its upper and lower boundaries. If Class A’s bus section runs from 20 to 30, it represents pupils, not 30 pupils. Composite bars let you compare both group totals and their components.
A percentage bar chart instead makes every bar reach 100%. Calculate each section using
For Class A, walking accounts for , while bus travel and cycling each account for 25%. For Class B, the corresponding percentages are 60%, 20% and 20%.
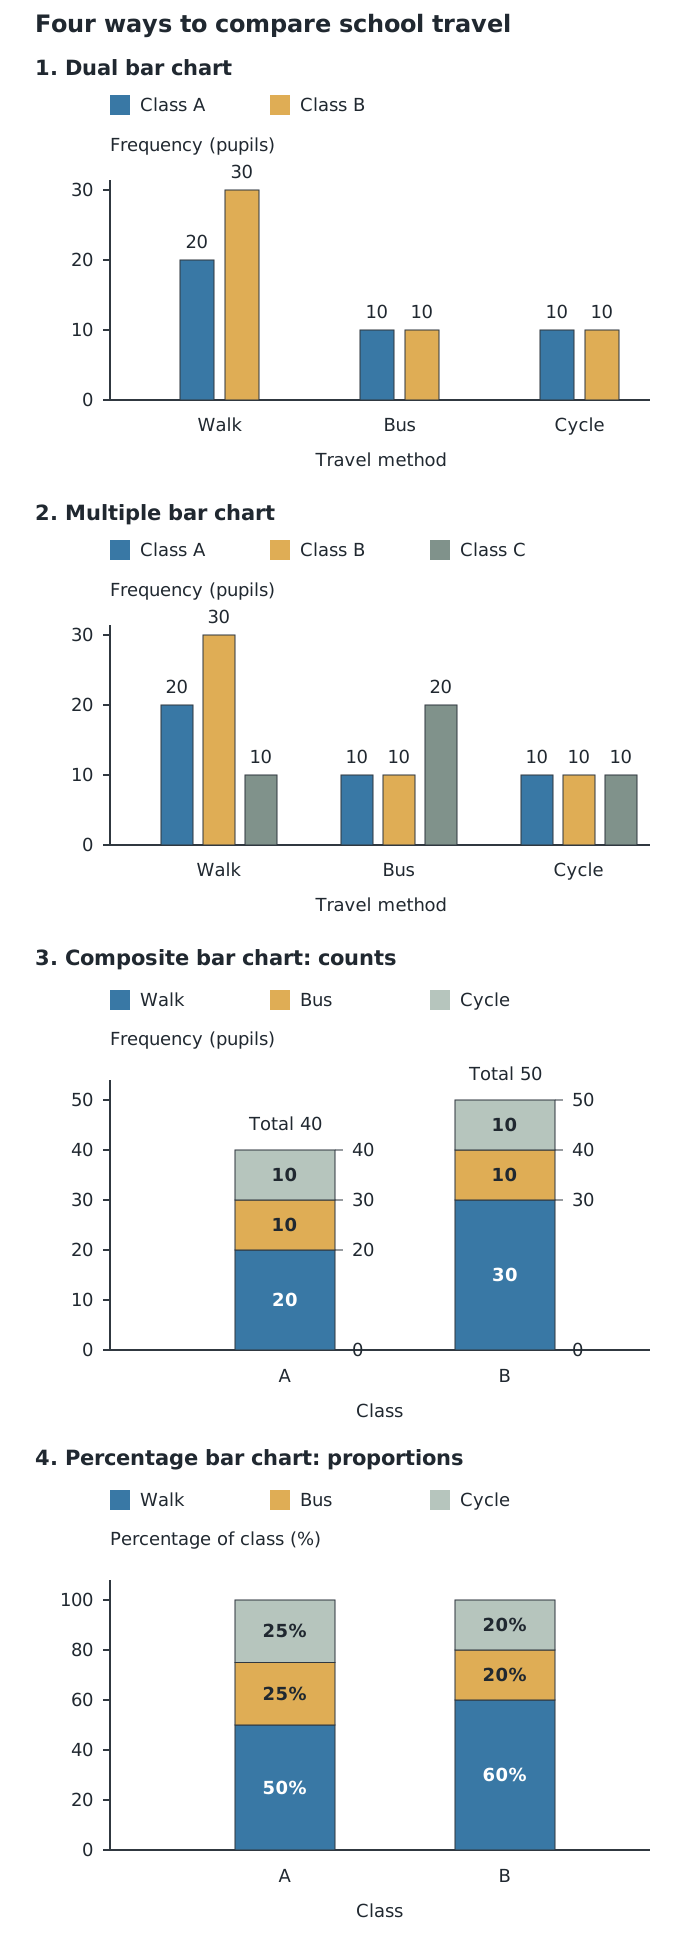
The same travel counts can be arranged to compare categories, group totals or percentages.
These two stacked forms answer different questions. Composite bars show that Class B is larger. Percentage bars show that walking makes up a greater share of Class B. Both classes have 10 bus passengers, but these represent 25% of Class A and only 20% of Class B. Equal counts need not mean equal proportions.
When combining groups, calculate a percentage from the combined frequencies and combined total. Here, 50 of the 90 pupils walk, so approximately 55.6% walk overall. Simply averaging the two class percentages would give each class equal weight even though their sizes differ.
A vertical line chart represents frequencies using thin vertical lines rather than bars. Put the numerical outcomes on the horizontal axis and frequency on the vertical axis. Each line rises from zero to its outcome’s frequency.
For example, suppose 3 pupils have no pets, 8 have one pet, 5 have two pets and 2 have three pets. Draw separate vertical lines at 0, 1, 2 and 3 pets, with heights 3, 8, 5 and 2. The tallest line shows that the modal number of pets is 1. Adding the line heights gives 18 pupils altogether.
The horizontal positions must respect the numerical scale: an outcome of 4 belongs twice as far from 0 as an outcome of 2. Do not join the tops of these separate frequency lines.
A time-series graph is a line graph with time on the horizontal axis and the recorded quantity on the vertical axis. Plot observations in chronological order and join successive points with straight lines. Unlike a vertical line chart, the connecting lines help show change from one time to the next.
Suppose a shop sells 40, 55, 45, 60, 50 and 70 items in six successive months.
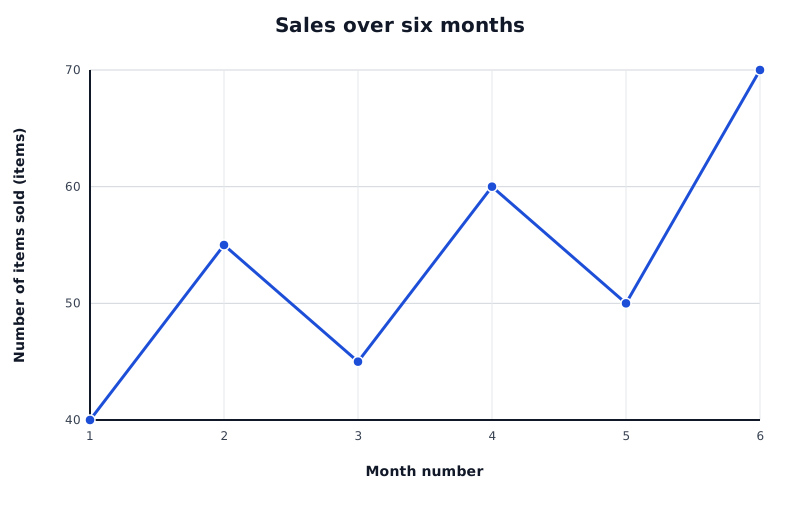
Suppose these are a shop’s sales in six successive months. Sales fluctuate, but the overall direction is upward.
Data for Sales over six months
| Series | Month number | Number of items sold (items) |
|---|---|---|
| Monthly sales | 1 | 40 |
| Monthly sales | 2 | 55 |
| Monthly sales | 3 | 45 |
| Monthly sales | 4 | 60 |
| Monthly sales | 5 | 50 |
| Monthly sales | 6 | 70 |
The overall trend is upward: sales rise from 40 items in month 1 to 70 in month 6. However, there are short-term falls from month 2 to month 3 and from month 4 to month 5. A useful description distinguishes the general trend from these fluctuations rather than claiming that sales increase every month.
When comparing two time series, compare their levels, overall directions and fluctuations over the same period. Check the scales before judging how steep or variable either series looks.
A scatter chart displays bivariate data: two numerical measurements for each observation. Each pair becomes one point. Where one variable is used to explain or predict the other, put that explanatory variable on the horizontal axis and the response variable on the vertical axis.
Suppose a shop records these pairs of temperature and ice-cream sales on five days: , , , and . Temperature is measured in °C and sales are numbers of ice creams. The first point belongs at 12°C horizontally and 20 ice creams vertically; its two values must stay together.
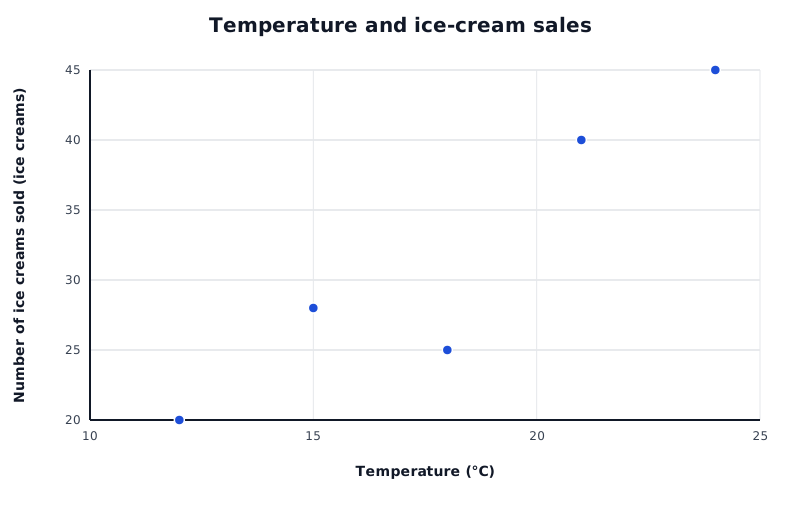
Suppose these temperature–sales pairs were recorded on five days. Each separate point represents one day.
Data for Temperature and ice-cream sales
| Series | Temperature (°C) | Number of ice creams sold (ice creams) |
|---|---|---|
| Temperature and ice-cream sales | 12 | 20 |
| Temperature and ice-cream sales | 15 | 28 |
| Temperature and ice-cream sales | 18 | 25 |
| Temperature and ice-cream sales | 21 | 40 |
| Temperature and ice-cream sales | 24 | 45 |
Plot separate crosses and do not join them. There is no time order implied by moving from one point to the next.
To interpret the chart, look at the overall pattern. Points tending upwards from left to right show a positive relationship; points tending downwards show a negative relationship. If there is no clear pattern, there is no clear relationship visible. In this example, higher temperatures tend to accompany higher sales, although the points do not all lie on a straight line.
A relationship on a scatter chart does not by itself prove that one variable causes the other. Other factors may also affect the measurements.
For combined groups, use combined frequencies and the combined total.
Check scales, units, keys and group totals. Support comparisons with values, differences or percentages in context.
Choose an evenly spaced numerical scale that includes the largest value, and label each axis with its variable and units where needed.
For a composite bar, subtract the lower boundary from the upper boundary to find a section’s frequency.
Compare percentages rather than just counts when group totals differ. A percentage bar chart does not show group sizes unless totals are also supplied.
Keep the two measurements from each observation paired when plotting a scatter chart; do not join its points.
Distinguish a vertical line chart of frequencies from a time-series graph whose successive points are joined.
It can see this note and what your specification asks for.
Answers are free with an account.
1 free note left this week
Get more free notesYour answer sets when this note comes back for review, or marks it complete.
Was this note helpful?
Log in to tell us whether it helped, or to report a problem.
Last updated
Frequency
The number of times a particular value or category occurs in a data set.
Categorical data
Data consisting of labels or categories, such as methods of travel.
Discrete data
Numerical data that takes distinct, separate values, such as the number of pets owned.
Bar chart
A chart in which equal-width, separated bars represent categories or discrete values; each bar’s height represents its frequency or another stated quantity.
Dual bar chart
A bar chart with two bars side by side for each category, comparing two data sets on the same scale.
Multiple bar chart
A bar chart with several bars side by side for each category, comparing more than two data sets.
Composite bar chart
A chart with bars divided into stacked sections. The whole bar represents a total, and each section represents one component of that total.
Percentage bar chart
A stacked bar chart in which every bar represents 100% of a group and each section shows a component’s percentage of that group.
Vertical line chart
A graph using separate vertical lines to show the frequencies of discrete numerical outcomes.
Time series
A set of observations recorded in time order, commonly at equally spaced intervals.
Scatter chart
A graph of paired numerical measurements, with one point for each observation, used to investigate a relationship between two variables.
Bivariate data
Data containing measurements of two variables for each observation.
Put your knowledge into practice — try past paper questions for Statistics
Frequency
The number of times a particular value or category occurs in a data set.
Categorical data
Data consisting of labels or categories, such as methods of travel.
Discrete data
Numerical data that takes distinct, separate values, such as the number of pets owned.
Bar chart
A chart in which equal-width, separated bars represent categories or discrete values; each bar’s height represents its frequency or another stated quantity.
Dual bar chart
A bar chart with two bars side by side for each category, comparing two data sets on the same scale.
Multiple bar chart
A bar chart with several bars side by side for each category, comparing more than two data sets.
Composite bar chart
A chart with bars divided into stacked sections. The whole bar represents a total, and each section represents one component of that total.
Percentage bar chart
A stacked bar chart in which every bar represents 100% of a group and each section shows a component’s percentage of that group.
Vertical line chart
A graph using separate vertical lines to show the frequencies of discrete numerical outcomes.
Time series
A set of observations recorded in time order, commonly at equally spaced intervals.
Scatter chart
A graph of paired numerical measurements, with one point for each observation, used to investigate a relationship between two variables.
Bivariate data
Data containing measurements of two variables for each observation.