

Loading…
Loading…
Loading…
AQA GCSE Statistics · 8382
AQA 8382 · 3.3.2 Advanced Pictorial Representations Check the specification (PDF) (opens in a new tab)
Pictorial representations use the sizes of shapes to communicate quantities. To interpret them correctly, first identify what their size represents: a length, an area or a volume. Then read the labels and key to establish the categories, units and totals being compared.
A frequency is the number of observations in a category. A proportion is that category’s fraction of the total. These answer different questions: ‘How many?’ and ‘What share?’ A category can become a larger share of a smaller data set while its actual frequency falls.
An ordinary pie chart divides a circle into sectors to show proportions. The whole circle represents the whole data set, so a sector with angle represents the proportion .
Two ordinary pie charts can have equal-sized circles even when their totals are different. Their sector angles still allow comparison of proportions, but equal sector angles do not establish equal frequencies.
Comparative pie charts also communicate the totals: the area of each whole circle is proportional to the total frequency it represents. A circle with twice the area represents twice the total. Within each circle, sector angles continue to show proportions.
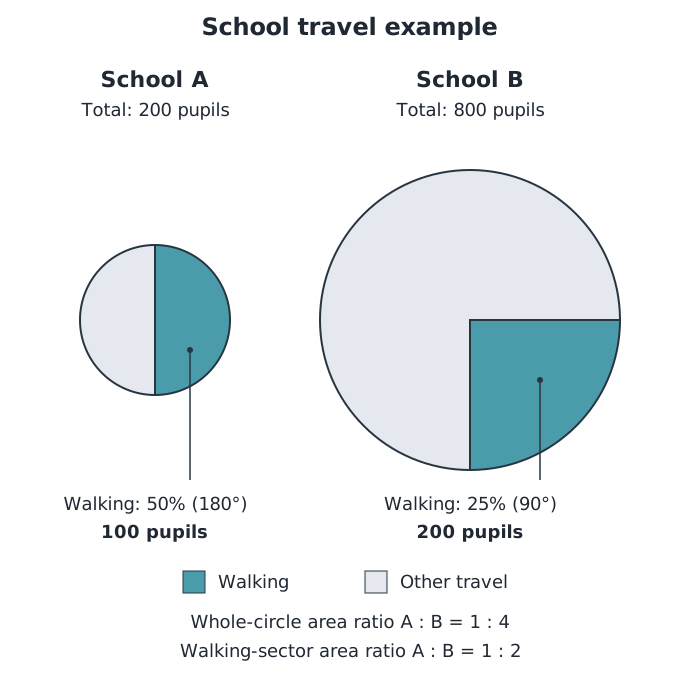
School A has the larger share walking, but School B has twice as many pupils walking.
Suppose School A surveys 200 pupils and School B surveys 800 pupils about travelling to school. Half of School A’s pupils walk, compared with a quarter of School B’s pupils. School A therefore has the larger proportion walking: 50% rather than 25%. However, the frequencies are pupils and pupils. School B has twice as many pupils walking.
On correctly scaled comparative pie charts, School B’s whole circle has four times School A’s area. Its walking sector has a smaller angle but a larger area. This is why angles compare proportions, whereas areas compare frequencies.
A circle’s area is , where is its radius. The area depends on the square of the radius, not the radius alone. Doubling a radius makes the area four times as large.
For two comparative pie charts, let and be their total frequencies, and and their radii. Since their areas are proportional to their totals,
For example, suppose one chart represents 500 people and has radius 2 cm. A second chart on the same scale has radius 6 cm. Its radius is three times as large, so its area and total frequency are nine times as large. It represents people.
Once the total is known, find a category’s frequency using its sector angle:
If instead a category’s frequency and angle are known, reverse the calculation to find the total:
A useful order is therefore to establish each chart’s total, calculate the relevant category frequencies, and then make the comparison requested.
Other two-dimensional displays may use the areas of circles, squares or similar pictures to represent quantities. When area encodes the data, compare areas rather than widths or heights alone.
For similar shapes, every corresponding length changes by the same linear scale factor, . Their areas change by . This happens because both dimensions contributing to area are scaled: for a rectangle, the new area is , which is times the original area.
For instance, suppose squares with side lengths 2 cm and 6 cm represent quantities through their areas. They have a length ratio of but an area ratio of . On a common scale, the larger square represents nine times the quantity. If the smaller square represents 40 items, the larger represents items.
You can also work backwards: if one similar picture represents four times the quantity, its area must be four times as large, so its corresponding lengths are times as large.
This rule depends on similarity. If a rectangle becomes twice as wide but stays the same height, its area doubles rather than quadruples. Check which dimensions have changed before drawing a conclusion.
A three-dimensional display may use the volumes of solids to represent quantities. For similar solids, multiplying every corresponding length by multiplies volume by . For a cuboid, length, width and height each contribute a factor of , giving .
For example, suppose two cubes represent quantities through their volumes. Their edge lengths are 2 cm and 4 cm, so the linear scale factor is 2. Their volumes are and . The larger cube represents eight times the quantity, not twice the quantity. If the smaller represents 50 items, the larger represents items.
The reverse relationship is also useful: a volume ratio of corresponds to a length ratio of for similar solids, because .
When reading a drawing of a solid, use its labelled dimensions and the key rather than judging its apparent size on the page. Perspective can make some edges look shorter. Check that volume really represents the quantity and that the solids are similar before cubing a corresponding-length ratio. You interpret these representations; you are not expected to draw them.
A pictorial display is useful when its key clearly explains what size represents and all groups use a consistent scale. Enlarging a picture’s width and height by a factor of 2 to show ‘twice as much’ actually gives it four times the area. Enlarging all three dimensions of a solid by the same factor gives it eight times the volume. Such choices exaggerate a difference if area or volume is meant to represent the quantity.
A strong comparison states the category and groups, distinguishes frequency from proportion, and supports the conclusion with a value or ratio. For example: ‘School A has the higher proportion walking, but School B has the higher number walking: 200 pupils compared with 100.’
For similar shapes or solids with linear scale factor :
When area or volume represents quantity, its ratio is also the quantity ratio. Check the key, common scale and dimensions that change. Support comparisons with quantities or ratios. Drawing 3D representations is not required.
For comparative pie charts, compare sector angles for proportions and sector areas for frequencies.
A larger proportion does not necessarily mean a larger frequency: check the total for each data set.
Square a length ratio when comparing areas; cube it when comparing volumes. These rules require similar shapes or solids.
Check whether size represents length, area or volume before interpreting a pictorial display.
Measure a diagram only when it is stated to be drawn accurately or to scale. Otherwise, use the supplied values.
You need to interpret comparative 3D representations, but you are not expected to draw them.
It can see this note and what your specification asks for.
Answers are free with an account.
1 free note left this week
Get more free notesYour answer sets when this note comes back for review, or marks it complete.
Was this note helpful?
Log in to tell us whether it helped, or to report a problem.
Last updated
Comparative pie chart
A pie chart in a set of charts whose whole-circle areas are proportional to the totals represented. Sector angles show category proportions.
Frequency
The number of times a value or category occurs in a data set.
Proportion
The fraction of the whole data set belonging to a particular category.
Sector
A region of a circle bounded by two radii and the arc between them; a slice of a pie chart.
Similar shape
Shapes with the same shape but possibly different sizes, whose corresponding lengths are all in the same ratio.
Linear scale factor
The multiplier that changes each corresponding length of one shape or solid into that of a similar shape or solid.
Put your knowledge into practice — try past paper questions for Statistics
Comparative pie chart
A pie chart in a set of charts whose whole-circle areas are proportional to the totals represented. Sector angles show category proportions.
Frequency
The number of times a value or category occurs in a data set.
Proportion
The fraction of the whole data set belonging to a particular category.
Sector
A region of a circle bounded by two radii and the arc between them; a slice of a pie chart.
Similar shape
Shapes with the same shape but possibly different sizes, whose corresponding lengths are all in the same ratio.
Linear scale factor
The multiplier that changes each corresponding length of one shape or solid into that of a similar shape or solid.