

Loading…
Loading…
Loading…
OCR GCSE Geography A · J383
OCR J383 · 1.3.5 UK Energy Management and Future Supplies Check the specification (PDF) (opens in a new tab)
The UK's energy system connects the energy available to the country with the energy people need. Supply comes from domestic production and imports, while demand comes from homes, industry, transport and services. These are not just electricity needs: petrol for vehicles and gas for heating also matter.
Energy statistics distinguish primary energy consumption, measured before conversion losses, from final energy consumption, the energy consumed by final users after transformation. For example, generating electricity from gas involves losses, so the fuel input contains more energy than the electricity eventually supplied. Figures expressed in million tonnes of oil equivalent (mtoe) compare different fuels using a common measure of energy content; they do not mean that all the energy came from oil.
Around 1950, coal dominated UK energy supply. Domestically mined coal heated homes, powered industry and steam trains, and generated almost all electricity. It was also used to manufacture town gas, a fuel supplied for cooking and heating. This made coal mining central to both everyday life and the economy.
From the 1960s, coal's importance declined as alternative fuels became more competitive. Industrial disputes, mine closures and a shrinking mining workforce contributed to the decline. Oil became increasingly important, and North Sea oil extraction began in 1975. Natural gas expanded, with particularly rapid growth in its use for electricity generation during the 1990s. Nuclear power stations built during the second half of the twentieth century also diversified electricity supply.
The change was therefore more than replacing one fuel in power stations. Different activities came to depend on different fuels. By 2024, oil dominated transport energy use: transport consumed 49.9 mtoe of oil out of its total 54.0 mtoe. Gas was the main heating fuel, with households consuming 21.8 mtoe of gas out of their total 34.0 mtoe.
Developing North Sea oil and gas increased domestic supply. The government supported exploration and production from the 1970s, working with multinational companies and receiving tax revenue from the industry.
The UK was a net energy importer during the 1970s but became a net exporter in 1981: it exported more energy than it imported. This was not a smooth transition. Output fell in the late 1980s following the Piper Alpha disaster, before the UK regained net-exporter status in the mid-1990s.
Overall energy production peaked in 1999, while natural gas production peaked in 2000. Since then, output from the UK's mature offshore oil and gas fields has generally declined. By 2024, oil production was 76% below its 2000 level and gas production was 73% lower. Bioenergy and waste production increased, but this did not outweigh the fall in fossil-fuel production.
The UK returned to being a net energy importer in 2004. In 2024, import dependency was 43.8%. Falling domestic output therefore did not mean that demand fell by the same amount: imports helped meet the difference. Greater reliance on overseas supplies makes international prices and supply disruptions important to UK energy security.
Between 1950 and 1973, UK primary energy consumption grew fairly steadily alongside economic output, although energy use rose more slowly than the economy. Rising living standards increased demand for central heating, private motoring, air travel and the road transport of goods. More activities required energy, even while improvements reduced the energy needed for some tasks.
The oil-price shocks of 1973 and 1979 disrupted this pattern. Higher oil prices fed through into wider energy costs, while the resulting recessions reduced economic activity. Both energy consumption and economic output fell in 1973–75. Growth resumed in 1975–79, before the second shock brought another sharp fall in consumption and output in 1979–81. Economic growth resumed after 1981, and energy consumption began growing again after 1982.
However, recovery did not simply restore the old relationship between energy use and output. Businesses cut energy costs, adopted more efficient technology and replaced inefficient equipment; some inefficient firms and plants closed. Manufacturing's fossil-fuel use remained relatively stable during recovery after 1982 despite rising output. By 1988, overall energy consumption was still below its 1973 level, although real economic output was about one-third higher.
Different sectors followed different paths. Manufacturing achieved substantial energy savings, but transport and household demand faced upward pressures from more travel, central heating and higher expectations of comfort. This explains why economic growth, energy efficiency and total demand need to be considered together: a growing economy does not necessarily require a matching increase in energy consumption.
UK primary energy consumption rose from 213.6 mtoe in 1990 to 234.8 mtoe in 2000, then fell to 164.4 mtoe in 2024. Domestic production fell much more sharply over the same period.
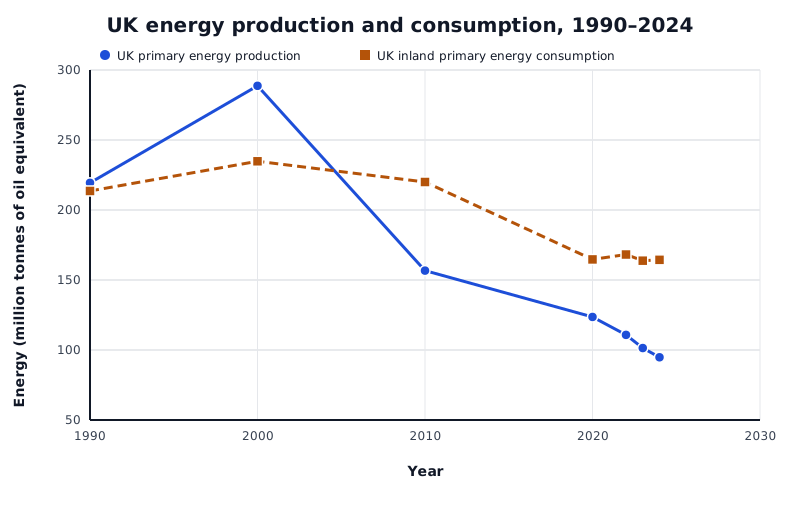
UK primary energy production and inland primary energy consumption at selected dates. Both generally declined after 2000, but domestic production fell more sharply. Consumption excludes non-energy use.
Data for UK energy production and consumption, 1990–2024
| Series | Year | Energy (million tonnes of oil equivalent) |
|---|---|---|
| UK primary energy production | 1990 | 219.4 |
| UK primary energy production | 2000 | 288.7 |
| UK primary energy production | 2010 | 156.7 |
| UK primary energy production | 2020 | 123.6 |
| UK primary energy production | 2022 | 110.8 |
| UK primary energy production | 2023 | 101.4 |
| UK primary energy production | 2024 | 94.8 |
| UK inland primary energy consumption | 1990 | 213.6 |
| UK inland primary energy consumption | 2000 | 234.8 |
| UK inland primary energy consumption | 2010 | 220 |
| UK inland primary energy consumption | 2020 | 164.7 |
| UK inland primary energy consumption | 2022 | 168.2 |
| UK inland primary energy consumption | 2023 | 163.8 |
| UK inland primary energy consumption | 2024 | 164.4 |
Read each line separately before comparing them. Between 1990 and 2000, production rose more strongly than consumption. In 2000, production still exceeded consumption: 288.7 mtoe compared with 234.8 mtoe. Both generally declined after 2000, but consumption exceeds production at every plotted date from 2010 onwards. The UK returned to net-importer status in 2004; the widely spaced plotted points do not identify that exact year. These two measures help explain the changing trading position, although their difference alone is not a complete calculation of import dependency.
The composition of consumption changed too. Coal supplied 31.3% of inland primary energy consumption in 1990 but only 1.5% in 2024. Gas's share rose from 24.0% to 35.6%, while bioenergy and waste rose from 0.3% to 12.3%. Oil's share increased slightly, from 36.1% to 38.0%, even though the amount of oil consumed fell. Its larger share was a share of a smaller total.
Demand depends on both the amount of activity taking place and the energy needed for each activity. Since 2000, improved insulation and more efficient boilers, lighting and appliances have reduced household energy intensity. Domestic energy consumption has fallen despite an increase in the number of households.
Industrial final energy consumption fell from 38.7 mtoe in 1990 to 19.5 mtoe in 2024. Over the longer period since 1970, falling industrial energy intensity reflects both more efficient production processes and changes in the kinds of products manufactured. Lower energy use does not necessarily mean an equally large fall in industrial output.
Short-term changes can interrupt these trends. Pandemic travel restrictions sharply reduced transport demand in 2020, followed by a recovery. Weather and prices also affect use: colder conditions increase heating needs, while high prices can encourage users to reduce consumption. In 2024, slightly cooler temperatures and some easing of the high prices experienced in 2023 contributed to rising household and services consumption. Total final consumption rose by 2.6%, even though industrial consumption continued to fall.
Government decisions affect investment, the competitiveness of fuels and the infrastructure available. Decisions about coal-mine closures were central to the 1984–85 miners' strike; production subsequently declined as costly mining faced competition from other fuels. Support for North Sea exploration had the opposite effect, helping expand oil and gas production.
Government also influenced demand. The Parker Morris housing standards became mandatory for new towns in 1967 and all council housing in 1969. Their heating requirements encouraged central heating and higher standards of warmth. In contrast, the Energy Efficiency Office, established in 1983, promoted energy efficiency, helping businesses reduce the energy required for production.
Policy also responds to ageing infrastructure. The 2007 White Paper, Meeting the Energy Challenge, identified the need to replace ageing power stations. New nuclear development, including Hinkley Point in Somerset, formed part of the response. Planning a station is not the same as immediately adding supply: major projects take time to develop.
Climate policy increasingly influenced the direction of investment. The Climate Change Act 2008 established a long-term framework for reducing greenhouse gas emissions. In 2019, the UK strengthened its commitment to achieving net-zero greenhouse gas emissions by 2050. Such commitments encourage movement away from high-emission fuels towards lower-carbon energy sources; they are targets shaping change, not proof that the transition is complete.
OPEC influences global oil markets. The large oil-price increases of 1973–74 strengthened the incentive for the UK to accelerate North Sea development. Higher imported oil costs made domestic resources more attractive, while also contributing to the fall in demand during the ensuing recession.
European rules also affected fuel choices. Restrictions on burning gas in power stations were lifted in the early 1990s, helping enable the rapid expansion of gas-fired electricity generation. This illustrates how changing a rule can allow a different energy mix, alongside changes in technology and fuel availability.
The European Union and United Nations have also influenced the UK through climate policies and international agreements aimed at reducing greenhouse gas emissions. These encouraged a shift away from coal and towards lower-carbon sources, including renewables. Gas produces less carbon dioxide than coal when burned for energy, but it remains a fossil fuel rather than a zero-carbon source.
Together, resource availability, technology, demand, government choices and international influences explain the changing pattern. No single factor accounts for the UK's move from coal dominance towards a more varied energy mix and renewed reliance on imports.
Distinguish total energy use from electricity use: transport fuels and gas used for heating are also part of the UK's energy demand.
Support a trend with dates and figures, then explain its causes. A list of fuels alone does not explain change.
Separate UK production from UK consumption: imported energy can meet demand when domestic output falls.
A fuel's percentage share can rise while the amount consumed falls, if total consumption falls.
Link a named decision-maker to an action and its effect, rather than simply listing government policies or international organisations.
It can see this note and what your specification asks for.
Answers are free with an account.
1 free note left this week
Get more free notesYour answer sets when this note comes back for review, or marks it complete.
Was this note helpful?
Log in to tell us whether it helped, or to report a problem.
Last updated
Energy mix
The combination of different energy sources used to meet a country's energy needs.
Energy demand
The amount of energy required by users, including households, industry, transport and services.
Primary energy consumption
Energy consumption measured before losses during conversion and transformation, such as fuel being converted into electricity.
Final energy consumption
Energy consumed by final users after transformation, such as electricity supplied to a household or petrol used in transport.
Net energy importer
A country that imports more energy than it exports.
Tonne of oil equivalent
A common energy unit used to compare different fuels by their energy content. Statistics often use million tonnes of oil equivalent, abbreviated to mtoe.
Energy intensity
The amount of energy used per unit of output or activity, such as energy used per household or per passenger kilometre travelled.
Energy security
Having reliable access to sufficient energy at an affordable price.
OPEC
The Organisation of Petroleum Exporting Countries: a group of oil-producing countries whose decisions can influence world oil supplies and prices.
Put your knowledge into practice — try past paper questions for Geography A
Energy mix
The combination of different energy sources used to meet a country's energy needs.
Energy demand
The amount of energy required by users, including households, industry, transport and services.
Primary energy consumption
Energy consumption measured before losses during conversion and transformation, such as fuel being converted into electricity.
Final energy consumption
Energy consumed by final users after transformation, such as electricity supplied to a household or petrol used in transport.
Net energy importer
A country that imports more energy than it exports.
Tonne of oil equivalent
A common energy unit used to compare different fuels by their energy content. Statistics often use million tonnes of oil equivalent, abbreviated to mtoe.
Energy intensity
The amount of energy used per unit of output or activity, such as energy used per household or per passenger kilometre travelled.
Energy security
Having reliable access to sufficient energy at an affordable price.
OPEC
The Organisation of Petroleum Exporting Countries: a group of oil-producing countries whose decisions can influence world oil supplies and prices.