

Loading…
Loading…
Loading…
OCR GCSE Geography A · J383
OCR J383 · Data Analysis and Statistics Check the specification (PDF) (opens in a new tab)
Geographical numbers describe things such as distances, areas, populations and traffic counts. A number becomes useful when you know what it measures and, where needed, its unit. A river width of 12 m is different from a river depth of 12 cm.
Counts usually use whole numbers: a traffic survey might record 40 vehicles. Measurements can use decimals because a distance or area need not be a whole number of metres or kilometres. Large quantities may be expressed in millions: 2.5 million means 2,500,000. Keeping the meaning and size of each number clear helps you judge whether a calculation is sensible.
A unit conversion changes how a quantity is expressed, not its actual size. Since , a distance of 2.4 km is 2,400 m. Multiply by 1,000 when converting kilometres to metres; divide by 1,000 when converting metres to kilometres. Similarly, .
Area conversions work differently from length conversions because area has two dimensions. A square measuring 1 km along each side measures 1,000 m along each side, so its area is .
Therefore:
To convert m² to km², divide by 1,000,000. To convert km² to m², multiply by 1,000,000. The same principle means that .
A ratio scale of 1:25,000 means that one unit on the map represents 25,000 of the same unit on the ground. Thus, 1 cm represents 25,000 cm, which is 250 m. A map distance of 4 cm therefore represents , or 1 km.
Map and ground distances are directly proportional at a fixed scale. Doubling the map distance doubles the ground distance. At 1:10,000, however, 1 cm represents 100 m, so the same 4 cm represents only 400 m. Always establish the scale before calculating.
A scale bar offers another way to convert distances: compare the measured distance with the length representing a stated ground distance. If a map has been enlarged or reduced, use its reproduced scale bar rather than assuming that the original printed ratio still applies.
For a rectangle, multiply its length by its width. For a triangle, multiply the base by the perpendicular height and halve the result:
The perpendicular height meets the base at a right angle. It is not necessarily a side of the triangle.
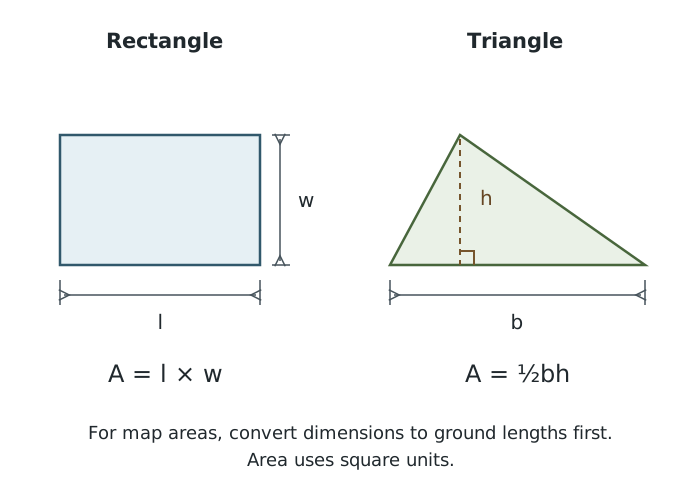
Area depends on two dimensions. A triangle’s height must be perpendicular to its base.
Suppose a rectangular field measures 4 cm by 2 cm on a 1:25,000 map. These lengths represent 1,000 m and 500 m, so its ground area is , or 0.5 km². Converting the lengths first makes it clear which units the answer should use.
Real geographical features rarely form perfect rectangles or triangles. You can estimate their areas by fitting simple shapes around their outlines, or dividing them into several shapes and adding the areas. Avoid counting the same area twice. The result is an approximation because the simple shapes do not follow every bend in the boundary.
For example, the Redmires Reservoirs can be approximated by two rectangles, A and C, and a triangle, B. At a map scale of 1:10,000, the measurements and calculations are:
| Reservoir | Approximate shape | Map dimensions | Ground dimensions | Approximate area |
|---|---|---|---|---|
| A | Rectangle | Length 5.5 cm; width 3 cm | Length 550 m; width 300 m | |
| B | Triangle | Base 5.5 cm; perpendicular height 4.2 cm | Base 550 m; perpendicular height 420 m |
Adding the three areas gives . Dividing by 1,000,000 gives an estimated total of . The detailed decimal answer does not make the shape approximation exact. On another map or a scaled photograph, the same method applies, but you must use that image’s scale and the feature’s own dimensions.
A proportion compares a part with the whole. Suppose a survey records 20 cyclists and 80 other road users. There are 100 road users altogether, so the proportion who are cyclists is , or 20%.
A ratio compares quantities in a stated order. In the same example, cyclists to other road users is , simplified to . For every cyclist, there are four other road users. Cyclists to all road users is a different ratio: .
Simplify a ratio by dividing both quantities by the same number. When comparing measurements, first express them in the same units: 500 m to 1 km becomes .
Magnitude concerns size. To compare relative sizes, divide one quantity by the other. Suppose one town has 60,000 residents and another has 20,000. The first has three times the population of the second, because . This is a multiplicative comparison; the numerical difference is 40,000 residents.
Frequency tells you how often something occurs. In a traffic survey, the frequency of bicycles is the number counted. In a rainfall record, it might be the number of days in a particular rainfall category.
Frequency can be expressed as a proportion of the total:
A five-minute traffic count with 6 bicycles out of 40 recorded transport movements has a bicycle proportion of , or 15%. Percentages help compare surveys with different totals: a count of 6 out of 40 represents a larger share than 6 out of 60. Comparisons of raw event counts also need comparable observation periods; 20 vehicles in five minutes is not directly equivalent to 20 vehicles in an hour.
A percentage expresses a proportion out of 100. To express a part as a percentage of a whole, use:
To calculate an amount from a percentage, reverse the process:
Suppose 30% of a 250-hectare area is woodland. The woodland covers hectares. The percentage describes its share; 75 hectares describes the actual area.
Percentage change compares a change with the starting value:
Suppose a comparable traffic count rises from 80 vehicles to 100 vehicles. The increase is 20 vehicles, and . A positive result indicates an increase.
If the count falls from 100 vehicles to 80, the signed change is : a 20% decrease. Although both changes involve 20 vehicles, the percentages differ because their starting values differ.
A change between two percentages can also be expressed in percentage points. An increase in woodland cover from 20% to 30% is 10 percentage points. Its percentage increase is .
A percentile describes where a value lies when data are ordered from smallest to largest. The 80th percentile is a value at or below which approximately 80% of observations lie. It is a measurement value, with the original variable’s unit—not an amount equal to 80% of the maximum.
To locate a percentile, first order the data or use a running count of observations up to each value. Calculate the target number of observations using:
Here, is the required percentile and is the total number of observations. Locate the measurement corresponding to this position. Different calculation conventions can give slightly different answers for small datasets, particularly between two observations.
For a concrete example, suppose 100 daily rainfall measurements are summarised as follows:
| Daily rainfall | Number of days at or below this amount |
|---|---|
| 5 mm | 50 |
| 12 mm | 80 |
| 20 mm | 95 |
For the 80th percentile, the target count is days. The table places the 80th-percentile threshold at 12 mm: 80% of the days have rainfall of 12 mm or less, and 20% have more than 12 mm.
The 50th percentile is the median; the 25th and 75th percentiles correspond to the lower and upper quartiles. A high percentile means a relatively high value, but whether that is desirable depends on what is being measured.
Convert map lengths to ground lengths before calculating ground area, and give area in square units.
For a triangle, use the height perpendicular to the base, not a sloping side.
Keep the order of a ratio consistent with the question and convert both quantities to the same units before simplifying.
Divide by the original value when calculating percentage change. State whether the result is an increase or decrease.
Keep unrounded values during calculations, then round the final answer to the precision requested.
A percentile is a position in an ordered distribution, not a percentage of the largest value. Follow any percentile-calculation convention given in the question.
It can see this note and what your specification asks for.
Answers are free with an account.
1 free note left this week
Get more free notesYour answer sets when this note comes back for review, or marks it complete.
Was this note helpful?
Log in to tell us whether it helped, or to report a problem.
Last updated
Area
The size of a surface or region, measured in square units such as m² or km².
Map scale
The relationship between a distance on a map and the corresponding distance on the ground.
Proportion
A part expressed in relation to the whole, often as a fraction, decimal or percentage.
Ratio
A comparison between quantities, written in a stated order, such as 1:4.
Direct proportion
A relationship in which multiplying one quantity by a factor multiplies the other by the same factor.
Magnitude
The size or relative size of a quantity or event.
Frequency
The number of times a value, category or event occurs in a dataset or stated period.
Percentage
A proportion expressed out of 100.
Percentage change
An increase or decrease expressed as a percentage of the original value.
Percentile
A value marking a specified percentage position in data ordered from smallest to largest. For example, approximately 80% of values lie at or below the 80th percentile.
Put your knowledge into practice — try past paper questions for Geography A
Area
The size of a surface or region, measured in square units such as m² or km².
Map scale
The relationship between a distance on a map and the corresponding distance on the ground.
Proportion
A part expressed in relation to the whole, often as a fraction, decimal or percentage.
Ratio
A comparison between quantities, written in a stated order, such as 1:4.
Direct proportion
A relationship in which multiplying one quantity by a factor multiplies the other by the same factor.
Magnitude
The size or relative size of a quantity or event.
Frequency
The number of times a value, category or event occurs in a dataset or stated period.
Percentage
A proportion expressed out of 100.
Percentage change
An increase or decrease expressed as a percentage of the original value.
Percentile
A value marking a specified percentage position in data ordered from smallest to largest. For example, approximately 80% of values lie at or below the 80th percentile.
| C | Rectangle | Length 3.8 cm; width 2.4 cm | Length 380 m; width 240 m |
Positive change = increase; negative change = decrease. Percentage points measure the difference between two percentages.