

Loading…
Loading…
Loading…
OCR GCSE Geography A · J383
OCR J383 · Types of Graphs and Charts Check the specification (PDF) (opens in a new tab)
A cross-section shows a slice through a landscape or feature. Imagine cutting across a river channel and looking at it from the side: the cross-section shows where the bed is shallow or deep. It is a particular use of a line graph, with distance across the feature on the horizontal axis.
For a river channel, the vertical axis shows depth below the water surface. Put zero depth at the top and increase depth downwards, so that the plotted line resembles the channel bed. Read the axis labels carefully: the measurements below are all in metres.
The River Syfynwy measurements provide a concrete example. At Site 1, the total channel width is 1.46 m:
| Distance from left bank (m) | Depth (m) |
|---|---|
| 0.24 | 0.13 |
| 0.49 | 0.13 |
| 0.73 | 0.12 |
| 0.97 | 0.18 |
| 1.21 | 0.16 |
To plot these measurements, choose evenly spaced numerical scales covering the full channel width and depth range. Find each distance on the horizontal axis, then move down to its depth. For example, the point at 0.97 m across the channel is 0.18 m below the surface. Join neighbouring points in distance order to show the bed profile. Where the water meets the banks, the depth is zero; the bank positions therefore mark the ends of the water surface.
The deepest measured point at Site 1 is 0.18 m. The word measured matters: readings taken at intervals may miss a deeper hollow between them. Joining points gives an approximation of the bed, not a record of every small irregularity.
Cross-sections can be compared side by side or on the same axes. Site 3 on the River Syfynwy is 3.59 m wide, compared with 1.46 m at Site 1. Its greatest recorded depth is 0.29 m, compared with 0.18 m. Site 3 is therefore both wider and deeper at its deepest measured point. Its depth decreases from 0.29 m at 1.80 m across the channel to 0.08 m at 3.00 m, showing the bed rising towards the right bank.
Use matching horizontal and vertical scales when comparing shape. Cross-sections can reveal differences between sites along a river or between a straight reach and a meander, but the graph alone does not establish what caused those differences.
A population pyramid shows population structure by age and sex. It consists of two sets of horizontal bars sharing an age axis. Younger groups are at the bottom and older groups at the top. Males are usually shown on the left and females on the right, but always check the labels.
Each bar represents an age group, commonly a five-year interval. Its length shows either the number of people or their percentage of the population. Read outwards from the central zero on each side: a longer left-hand bar means more males in that age group, not a negative population.
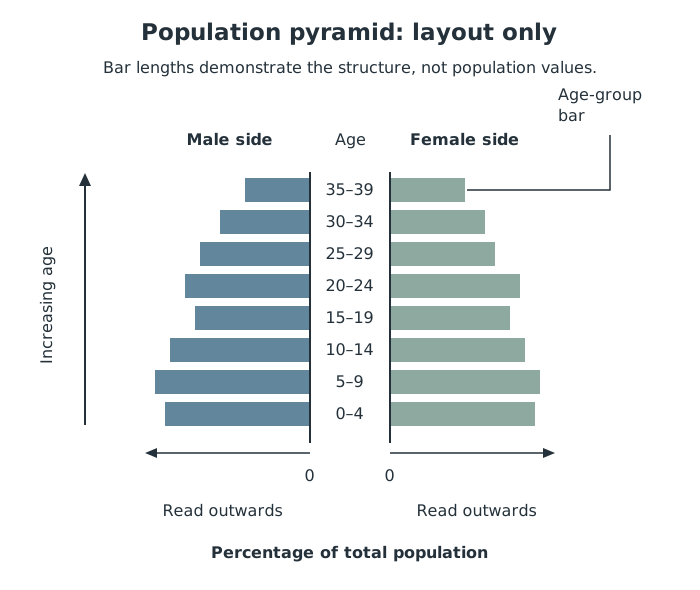
Population-pyramid layout: age increases upwards, while bar lengths are read outwards from the central zero.
Suppose a pyramid shows males aged 10–14 as 4% of the total population and females aged 10–14 as 3%. Together, that age group accounts for 7% of the population. This interpretation depends on the percentage denominator: check whether percentages refer to the whole population or to each sex separately.
Start with the base, then the middle and the top. A broad base means a large proportion of children and can suggest relatively high recent birth rates. A narrow base compared with the middle suggests smaller recent birth cohorts. A relatively broad top shows a larger proportion of older people and can indicate that more people survive to older ages.
Look for bulges, gaps and differences between the sexes as well as the overall shape. A bulge represents a relatively large age group; a gap represents a smaller one. Changes in births, deaths and migration can affect these patterns, so shape alone cannot prove a particular explanation.
Pyramids allow comparisons between places and between dates. Percentage scales help compare population structure where total population sizes differ; numbers show the actual size of age groups. A high proportion of children may imply greater demand for schools, while a high proportion of older people may imply greater demand for health and care services. These are implications of the structure, not services directly measured by the pyramid.
A radial graph has several axes, or spokes, radiating from a central point. Each spoke represents a category or variable. Values are plotted along the spokes and may be joined to make a closed shape. These are also called radar or spider graphs.
For example, suppose an environmental-quality survey rates four features from 0 to 5, with higher scores always meaning better conditions. The scores are cleanliness 4, quietness 2, greenery 5 and building condition 3.
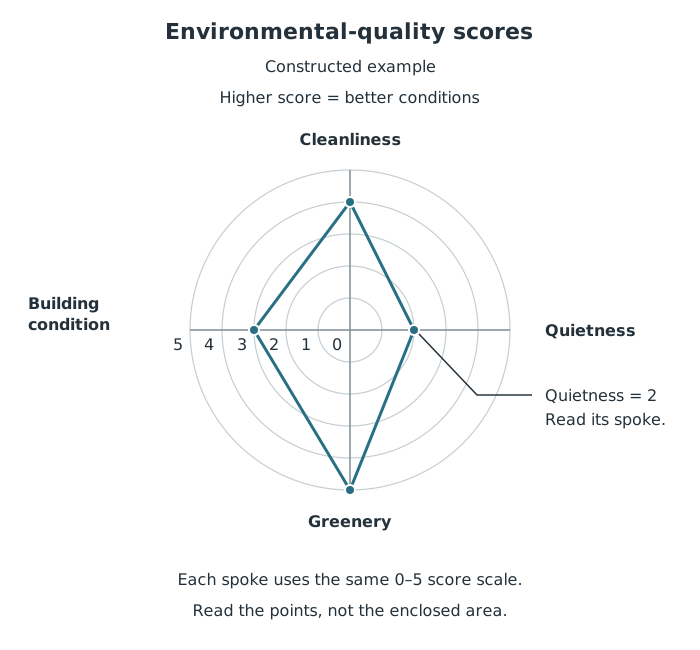
A constructed survey example: greenery scores 5, while quietness scores 2. Read each value on its own spoke.
To construct the graph, label the spokes, use the same score scale on each, plot the four values and join neighbouring points, including the last back to the first. To read it, follow each spoke to the plotted point and use the scale. In this example, greenery receives the highest score and quietness the lowest, suggesting noise is a relative weakness.
A second line could show another site or the same site at a later date. Compare corresponding spokes using the key. The enclosed shape helps reveal a pattern, but its area is not a separate measured quantity. The order of the categories can also change its appearance. Transfer this method to real survey results only after checking what each score means and whether the scales are comparable.
A rose chart is circular, but its directions have geographical meaning. Compass directions are arranged around the centre, with north at the top. Rose charts can display continuous measurements, such as wind direction and speed, grouped into direction sectors and speed bands.
For a wind rose, first read the title and time period. Then check the radial scale: it may show the number of observations, days or a percentage. Finally, read the key to find how wind speeds are represented. Wind direction names where the wind comes from: a south-westerly wind comes from the south-west.
The OCR wind-rose example for 2016 records 43 days with wind from the south-east and 39 days from the south-west. South-east therefore has the higher frequency of these two individual directions. However, the combined sector from south-south-west through west-north-west accounts for 148 days, around 40% of the year, showing a broad concentration of winds from that part of the compass.
Speed adds a different layer of information. In the same example, winds in the 19–30 knot band were most common from the south-west, occurring on 8 days, whereas winds of 2–9 knots occurred most frequently from the south-east. The direction with the most frequent winds is therefore not necessarily the direction associated with the strongest winds.
To analyse a rose chart, give the direction, read its frequency from the scale, and use the speed key to qualify the pattern. This helps distinguish frequent exposure to wind from exposure to less frequent but stronger winds.
Support comparisons with values and units, rather than only describing one graph as larger.
Check scales before comparing graphs: different axis scales can exaggerate differences.
On a river cross-section, distinguish distance across the channel from depth below the water surface.
On a population pyramid, check whether the horizontal scale shows numbers or percentages and read each sex separately.
On radial graphs, compare values on individual spokes, not just the area enclosed by the line.
On a wind rose, distinguish the most frequent wind direction from the direction of the strongest winds.
It can see this note and what your specification asks for.
Answers are free with an account.
1 free note left this week
Get more free notesYour answer sets when this note comes back for review, or marks it complete.
Was this note helpful?
Log in to tell us whether it helped, or to report a problem.
Last updated
Cross-section
A graph showing a slice through a landscape or feature, such as the shape of a river channel.
Population pyramid
A diagram using horizontal bars to show the age and sex structure of a population.
Population structure
The composition of a population, particularly its distribution by age and sex.
Radial graph
A circular graph with axes radiating from a central point, used to display values for different categories or variables.
Rose chart
A circular chart showing directional data, such as the frequency and speed of winds from different compass directions.
Prevailing wind
The direction from which the wind blows most frequently.
Continuous data
Numerical data that can take any value within a range, such as wind speed or water depth.
Put your knowledge into practice — try past paper questions for Geography A
Cross-section
A graph showing a slice through a landscape or feature, such as the shape of a river channel.
Population pyramid
A diagram using horizontal bars to show the age and sex structure of a population.
Population structure
The composition of a population, particularly its distribution by age and sex.
Radial graph
A circular graph with axes radiating from a central point, used to display values for different categories or variables.
Rose chart
A circular chart showing directional data, such as the frequency and speed of winds from different compass directions.
Prevailing wind
The direction from which the wind blows most frequently.
Continuous data
Numerical data that can take any value within a range, such as wind speed or water depth.