

Loading…
Loading…
Loading…
OCR GCSE Geography A · J383
OCR J383 · Map Construction and Interpretation Check the specification (PDF) (opens in a new tab)
A map normally shows the landscape from above. This is useful for locating roads, rivers and settlements, but it does not directly show what the land would look like from the side. Relief describes the height and shape of the land. Contours and spot heights help you interpret relief on Ordnance Survey (OS) maps.
A contour joins points at the same height above sea level. Following a contour therefore means following one height, rather than travelling uphill or downhill. On OS maps, contours appear as thin orange or brown lines, with numbers showing their heights in metres above sea level.
The contour interval is the vertical difference between successive contours. OS maps commonly use intervals of 10 metres, or 5 metres in flatter areas; check the map key for the interval actually used. If successive lines are labelled 100, 120 and 140 metres, their interval is 20 metres.
A spot height gives the height of one particular point. On an OS map, a black dot with a number beside it marks that point's height in metres above sea level. It adds a precise height at that location, whereas a contour lets you trace the same height across the map. A spot height is not automatically a summit: its location matters.
Contours are one type of isoline. Other isoline maps join points with equal values of other measurements, such as temperature or atmospheric pressure. Always check the mapped variable, its units and the interval between lines before interpreting a pattern. Closely spaced lines show that the mapped value changes rapidly over a short distance; only height contours describe the steepness of the land.
Compare contour spacing over a similar map distance. Closely spaced contours mean that height changes rapidly over a short horizontal distance: the slope is steep. Widely spaced contours mean that the same height change takes place over a greater distance: the slope is gentle. Spacing tells you about steepness, while the contour numbers tell you about height. High ground can have gentle slopes, and low ground can have steep slopes.
Nested closed contours with heights increasing towards the centre indicate a hill. Read the numbers as well as the shapes: the direction in which height increases tells you which way is uphill. The highest contour does not necessarily give the summit's exact height, because the summit may lie above it.
These patterns connect the overhead map view to the side view of the landscape. Along a line crossing a hill, heights first increase and then decrease. On a cross-section, that becomes a rising slope followed by a falling slope.
Gradient expresses steepness numerically by comparing a change in height with the horizontal distance over which it occurs.
Find the heights of the two endpoints using contours or spot heights, then subtract to obtain the vertical change. Measure the horizontal distance between them using the map scale. Put both quantities into the same units before calculating.
For example, suppose a slope rises from 100 metres to 150 metres above sea level over a horizontal distance of 1,000 metres. Its rise is 50 metres, so its gradient is . Dividing both sides by 50 gives 1:20, or 1 in 20. This means one metre of vertical change for every 20 metres horizontally. It describes the average gradient between the endpoints; parts of the slope may be steeper or gentler.
A cross-section shows a vertical slice through the landscape along a selected line, usually labelled A–B. Its horizontal axis shows distance along that line, and its vertical axis shows height above sea level.
To build one, place the edge of a strip of paper along A–B on the map. Mark A, B and every point where a contour crosses the paper. Write the contour height beside each mark, taking care to record repeated crossings of the same height. You can also mark features such as a river crossing.
Transfer the marks to a horizontal axis that matches the length and horizontal scale of A–B. Choose a regular vertical scale that includes the relevant heights. Plot each height directly above its distance mark, then join the points to form the relief profile. Give the section a title and label both axes and their units.
The map provides heights at contour crossings, not at every point between them. The line between plotted heights is therefore an estimate of the ground's shape. Do not add an exact summit height unless a spot height or other evidence supplies it.
Consider this constructed example of heights along a line across a hill.
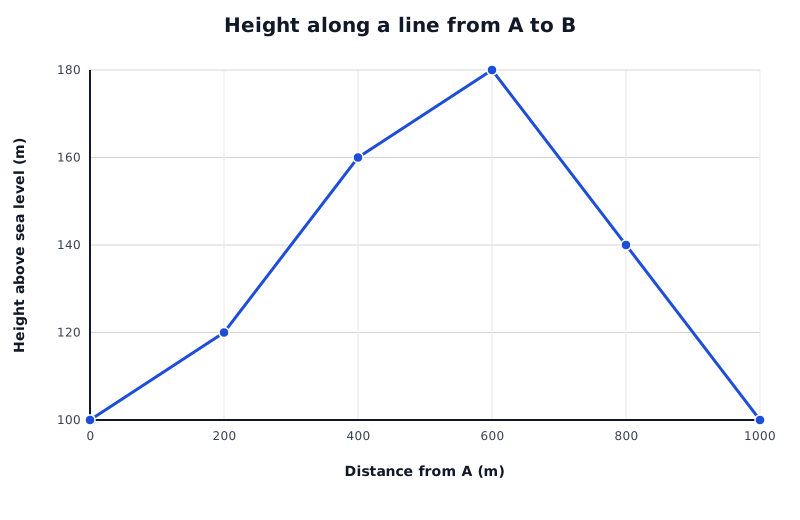
A constructed relief profile: compare height changes over equal horizontal distances to identify steeper and gentler parts.
Data for Height along a line from A to B
| Series | Distance from A (m) | Height above sea level (m) |
|---|---|---|
| Cross-section A–B | 0 | 100 |
| Cross-section A–B | 200 | 120 |
| Cross-section A–B | 400 | 160 |
| Cross-section A–B | 600 | 180 |
| Cross-section A–B | 800 | 140 |
| Cross-section A–B | 1000 | 100 |
From A to 600 metres along the line, the land rises from 100 to 180 metres. It then falls towards B. The steepest rising part is between 200 and 400 metres: height increases by 40 metres over 200 metres horizontally. Between 400 and 600 metres, it rises by only 20 metres over the same distance, so that part is gentler.
A useful interpretation identifies the overall landform, the highest and lowest plotted points, and changes in slope. Support each statement with locations and values rather than describing the whole line simply as ‘steep’ or ‘hilly’.
Check the axis scales too. A section with an expanded vertical scale can make slopes look much steeper than they are. Calculate gradient from the labelled values, not from the apparent angle of the line.
A transect records information along a line across an area. A transect diagram can use a cross-section as its base and add information about land use, vegetation, settlement or other features at the corresponding positions.
Suppose the first 400 metres of the example line are farmland, the next 400 metres are woodland, and the final 200 metres are farmland. These categories could be shown in labelled bands beneath the profile, aligned with the distance axis. You could then identify woodland on the higher central ground and farmland towards both ends. The profile alone cannot tell you those land uses: they must come from mapped information or observations.
Interpret a transect by first describing changes along the line, then comparing the information layers. For example, does woodland coincide with higher ground or steeper slopes? An association can suggest an explanation, but does not by itself prove that relief caused the land-use pattern.
The same methods transfer to an authentic OS map: read its heights and interval, record crossings accurately, and match additional information to positions along the selected line. Remember that a cross-section or transect represents that line, not every part of the surrounding area.
Use the same units. For a gradient of 1 in :
A smaller means a steeper slope. This is the average gradient between the selected points.
Use the contour interval shown on the map; do not assume that every map uses the same interval.
For gradient, use the difference in height, not the height of the highest point. Convert height and horizontal distance to the same units.
A gradient of 1 in 5 is steeper than 1 in 20: the same rise occurs over a shorter horizontal distance.
Support interpretations with heights, distances and locations along the section. Distinguish a pattern you can observe from a possible explanation.
Check both axis scales before comparing slopes on cross-sections.
It can see this note and what your specification asks for.
Answers are free with an account.
1 free note left this week
Get more free notesYour answer sets when this note comes back for review, or marks it complete.
Was this note helpful?
Log in to tell us whether it helped, or to report a problem.
Last updated
Relief
The height and shape of the land, including differences between high and low ground.
Isoline
A line on a map joining points with the same value, such as height or temperature.
Contour
A line on a map joining points at the same height above sea level.
Contour interval
The vertical difference in height between successive contour lines.
Spot height
The height of a particular point marked on a map, usually given in metres above sea level.
Gradient
The steepness of a slope, calculated by comparing its vertical change in height with its horizontal distance.
Cross-section
A diagram showing a vertical slice through the landscape along a selected line.
Transect
A line across an area along which information is recorded; a transect diagram can combine a relief profile with information such as vegetation or land use.
Put your knowledge into practice — try past paper questions for Geography A
Relief
The height and shape of the land, including differences between high and low ground.
Isoline
A line on a map joining points with the same value, such as height or temperature.
Contour
A line on a map joining points at the same height above sea level.
Contour interval
The vertical difference in height between successive contour lines.
Spot height
The height of a particular point marked on a map, usually given in metres above sea level.
Gradient
The steepness of a slope, calculated by comparing its vertical change in height with its horizontal distance.
Cross-section
A diagram showing a vertical slice through the landscape along a selected line.
Transect
A line across an area along which information is recorded; a transect diagram can combine a relief profile with information such as vegetation or land use.