

Loading…
Loading…
Loading…
OCR GCSE Geography A · J383
OCR J383 · Map Construction and Interpretation Check the specification (PDF) (opens in a new tab)
A geographical information system (GIS) is a computer system that stores, checks, analyses and displays information linked to locations on Earth. It connects where something is with what it is like. For example, a mapped school can be linked to information about its name and number of pupils.
Information with a location is called geospatial data. Its location might be precise, such as coordinates, or broad, such as a country name. The descriptive information attached to a feature is called attribute data. Selecting a feature in a GIS can reveal these attributes, allowing you to move between a map and the information behind it.
This makes GIS more than a digital picture of a map: it can help answer geographical questions, such as which buildings lie in a flood-risk area or where pollution sources are close to sensitive environments.
GIS organises information into layers. One layer might show rivers, another buildings and another flood risk. Displaying layers together is called an overlay. Because they share a geographical reference, you can compare features occupying the same locations.
Features can be represented as points, lines or areas: for example, monitoring sites, roads and flood-risk zones. Other layers use a grid of cells or pixels, as satellite images do. You do not need to see every layer at once. Hiding an irrelevant layer can make a pattern easier to recognise.
Layers must align geographically for a comparison to be meaningful. GIS can bring information from different maps into a common geographical framework, but this does not make inaccurate or outdated information reliable.
Start by establishing what the display shows: its location, geographical extent, layer names and dates. Read the key carefully to find out what symbols, colours and any numerical classes mean. Check the units and scale before judging distances or the size of an area.
Next, describe the distribution. Look for clusters, gaps, concentrations, changes in a particular direction and unusual features. Use precise locations and values where available.
To interpret the display, explain what those observations suggest. To analyse it, compare locations or layers systematically and use the evidence to answer a question. For example, compare building locations with a flood-risk layer to identify potentially exposed buildings, then examine their attributes to understand who might be affected.
Suppose a GIS contains two layers for a fictional neighbourhood: building locations and a mapped flood-risk zone. The grid runs eastwards and northwards in metres, with each grid interval representing 100 m. The flood-risk zone extends from 50 to 250 m in both directions.
The building layer has these linked attributes:
| Building | Eastward position (m) | Northward position (m) | Residents |
|---|---|---|---|
| A | 100 | 100 | 2 |
| B | 200 | 200 | 4 |
| C | 300 | 300 | 3 |
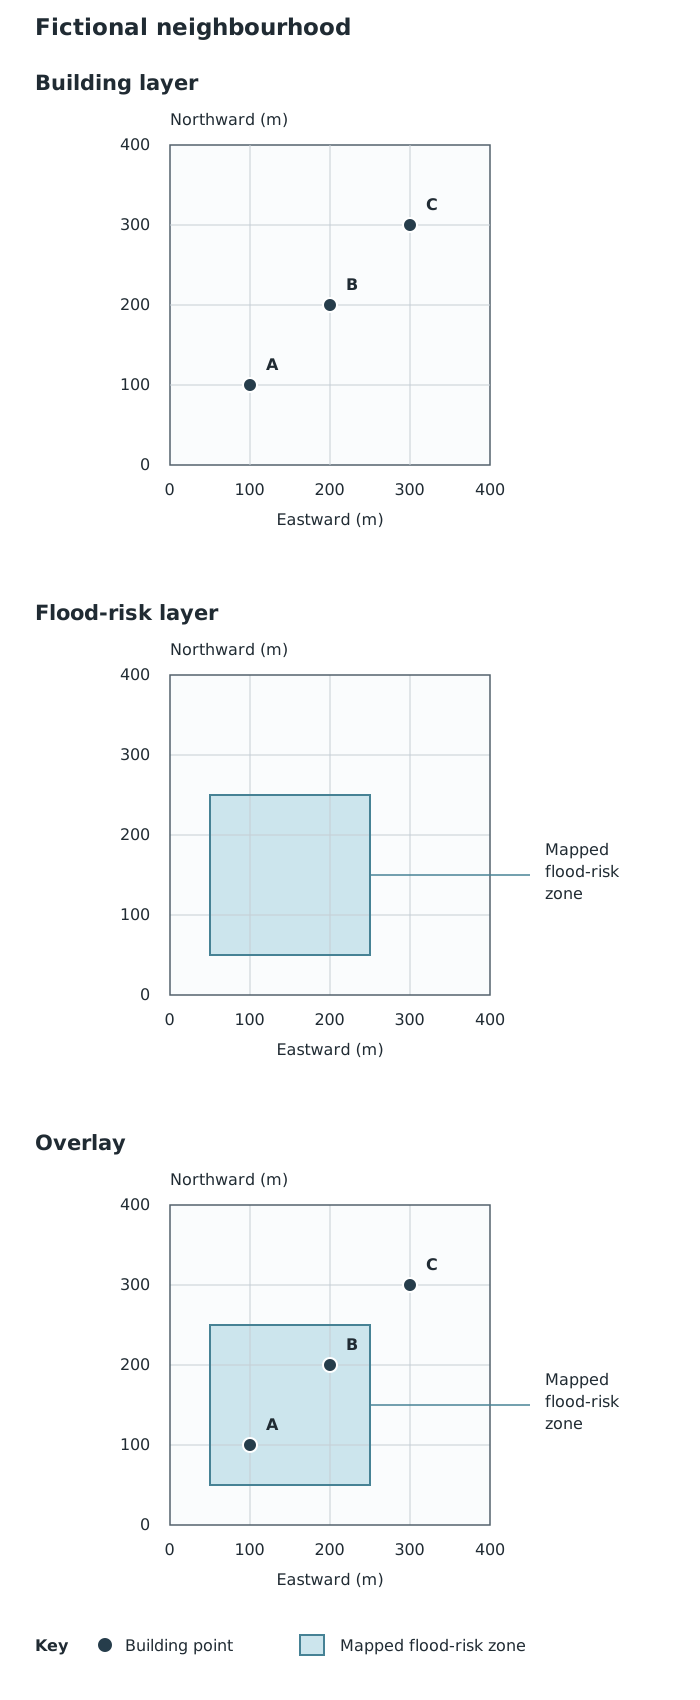
Comparing aligned layers reveals which buildings lie within a mapped flood-risk zone. Each grid interval represents 100 m.
Reading the building layer alone, you can describe the three buildings as lying along a south-west to north-east alignment. Overlaying the flood-risk zone reveals that A and B lie inside it, whereas C lies outside it. Checking the attribute table shows that B has more residents than A.
A supported interpretation is that A and B may need particular attention in flood planning. The overlay identifies potential exposure; it does not show that a flood has occurred or establish how badly either building would be affected. Nor does C’s position outside this particular zone guarantee that it is safe from every source of flooding.
On an authentic GIS display, use its own key, scale and attributes in the same way: identify the relevant layers, compare their locations and support a conclusion with mapped evidence. Unlike this simplified example, real zones may have irregular boundaries and many buildings, so careful selection and checking are important.
GIS is useful because it brings different kinds of information together and makes spatial relationships easier to recognise. It can support decisions about emergency planning, environmental protection or the location of services.
However, a mapped relationship is not automatically an explanation. Factories near a polluted river might be worth investigating, but proximity alone does not prove that they caused the pollution.
The strength of a conclusion also depends on the data. An old building layer may omit new homes; layers from different dates may not describe conditions at the same time. Broad area-level data may hide differences within an area. State what the mapped evidence supports, and qualify conclusions where the information is incomplete or uncertain.
Support a spatial description with locations, directions and data values rather than saying only that features are ‘unevenly distributed’.
Distinguish description from interpretation: first state the mapped pattern, then explain what it might mean.
Overlapping layers can suggest a relationship, but do not by themselves prove cause and effect.
Check the key, units, scale and dates of the layers before comparing them.
It can see this note and what your specification asks for.
Answers are free with an account.
1 free note left this week
Get more free notesYour answer sets when this note comes back for review, or marks it complete.
Was this note helpful?
Log in to tell us whether it helped, or to report a problem.
Last updated
Geographical information system (GIS)
A computer system for capturing, storing, checking, analysing and displaying information linked to locations on Earth.
Geospatial data
Information that includes a location, such as coordinates, an address or a named country.
Layer
A set of geographical information displayed together in a GIS, such as roads, buildings or flood-risk areas.
Attribute data
Descriptive information linked to a mapped feature, such as a building’s use or the number of people living there.
Overlay
Placing geographical layers over one another so that their locations and relationships can be compared.
Spatial analysis
Examining location-based data to identify patterns and relationships and draw useful conclusions.
Put your knowledge into practice — try past paper questions for Geography A
Geographical information system (GIS)
A computer system for capturing, storing, checking, analysing and displaying information linked to locations on Earth.
Geospatial data
Information that includes a location, such as coordinates, an address or a named country.
Layer
A set of geographical information displayed together in a GIS, such as roads, buildings or flood-risk areas.
Attribute data
Descriptive information linked to a mapped feature, such as a building’s use or the number of people living there.
Overlay
Placing geographical layers over one another so that their locations and relationships can be compared.
Spatial analysis
Examining location-based data to identify patterns and relationships and draw useful conclusions.