

Loading…
Loading…
Loading…
OCR GCSE Geography A · J383
OCR J383 · Map Construction and Interpretation Check the specification (PDF) (opens in a new tab)
A map represents an area from above, but it cannot show everything. Its usefulness depends on selecting information that answers a geographical question. A detailed Ordnance Survey (OS) map can help locate fieldwork sites and measure distances. A simplified sketch map can highlight the relationship between those sites. A thematic map focuses on a particular topic, such as transport connections or population density.
Start by reading the title, key, scale and orientation. The key explains what symbols, lines and colours mean; their appearance alone is not enough to identify them. Symbols allow roads, rivers and buildings to be represented without covering the map in writing.
Coordinates describe a position using an agreed reference system. OS maps of Great Britain use the National Grid. Two letters identify a 100 km grid square, which is divided into smaller squares. On the detailed maps used here, the numbered grid lines are 1 km apart.
Eastings are the vertical grid lines: their numbers increase as you move east, across the map. Northings are the horizontal grid lines: their numbers increase as you move north, up the map. Read the easting first, then the northing — ‘along the corridor, then up the stairs’.
A four-figure grid reference identifies a whole 1 km square. Find the square containing the feature and read the two-digit easting of its left edge, followed by the two-digit northing of its bottom edge. For example, a square between eastings 62 and 63 and northings 33 and 34 has the reference 6233. Both numbers describe its bottom-left corner.
A six-figure grid reference gives a more precise position within that square. Imagine dividing each side into ten equal parts. Each tenth represents 100 m. Add the tenths across to the easting, then the tenths up to the northing. A point five-tenths across and three-tenths up square 6233 has the reference 625333, which may also be written 625 333. It is more precise than a four-figure reference, but does not locate a feature to the nearest metre.
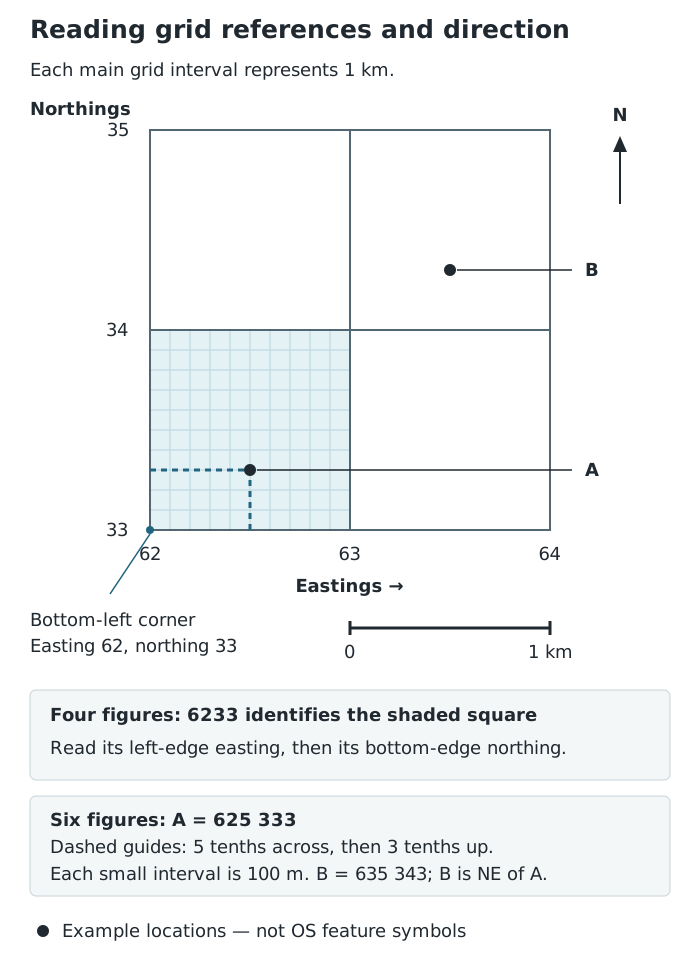
Square 6233 contains A at 625333. B lies north-east of A. Each main grid square is 1 km across.
The same method transfers to an authentic OS map: find the containing square first, then estimate the tenths using the position of the feature's symbol. Include the National Grid letters when a reference needs to identify the location beyond a particular map extract.
OS maps are printed with north at the top. East is to the right, south at the bottom and west to the left. The intermediate directions are north-east, south-east, south-west and north-west.
To describe the direction from A to B, start at A and look towards B. In the grid demonstration, B is north-east of A because it lies both further east and further north. Reversing the journey reverses the direction: A is south-west of B. On a rotated map or another kind of map, use its north arrow rather than assuming that the top is north.
A map scale expresses how much the ground has been reduced. At 1:25,000, one unit on the map represents 25,000 of the same units on the ground. Therefore, 1 cm represents 25,000 cm, which is 250 m. Suppose two points are 4 cm apart on a map printed at this scale. Their ground distance is cm: 1,000 m, or 1 km.
The general relationship, using the same units for both distances, is:
A scale bar is a line marked with ground distances. You can compare a measured map length directly with this bar rather than calculate from the ratio scale. On a detailed OS map, a grid square is 1 km from side to side; crossing it diagonally is longer, so simply counting squares is only a rough distance estimate.
For a straight-line distance, measure between the two specified points with a ruler and convert using the scale. This is sometimes called distance ‘as the crow flies’. It does not follow the bends of a road, path or river.
For a winding route, place one end of a piece of string at the starting point and carefully follow every bend. Mark the string at the destination, then straighten the measured section without stretching it. Compare it with the scale bar, or measure it with a ruler and convert using the ratio scale. You have finished tracing when the string reaches the stated endpoint, not merely a nearby feature.
Alternatively, use the edge of a strip of paper. Mark the starting point and align the edge with the first section of the route. At each bend, mark the distance reached, pivot the paper about that mark and follow the next section. Continue until the destination, then compare the accumulated length with the scale bar. A route distance is usually longer than the straight-line distance between its endpoints.
A scale bar is particularly useful for a map displayed on a screen or resized in a document. It changes size with the map, whereas a printed ratio describes the map only at its intended size. For example, if every length on a 1:25,000 map is doubled, 1 cm on the enlarged map represents only half as much ground: 125 m. Its new ratio scale is therefore 1:12,500. The enlarged scale bar still gives the correct ground distances, provided it was resized together with the map.
A larger-scale map has a smaller denominator and shows more detail over a smaller area. Choose detailed mapping for locating nearby fieldwork sites; choose a smaller-scale map when the important information is the wider regional pattern.
A sketch map is a purposeful simplification, not a copy of every feature. Decide what the map needs to communicate before drawing it.
For an investigation of downstream change on the River Syfynwy, the river course and the three sampling sites are central. Site 1 is furthest upstream, 1.15 km from the source; Site 2 is 1.24 km from the source; Site 3 is 3.75 km from the source. A useful sketch would retain the river and site positions and annotate these distances. It could omit unrelated buildings rather than crowding the map. The investigation measures channel depth, width and flow velocity, so the selected features should help communicate that investigation, not merely reproduce the original map.
A flow line map shows connections or movement between places. The key links line width to an amount. In the Skinningrove public-transport example, the wide connection to Middlesbrough represents around 40 buses per day. Guisborough and Whitby have narrower connections representing fewer than 10 buses per day. This supports the conclusion that Skinningrove has a stronger bus connection to Middlesbrough. It does not, by itself, show passenger numbers or journey times.
A choropleth map shades areas according to numerical classes. It is useful for comparing a measure such as population density or a percentage between areas. Use clear, non-overlapping classes and a logical sequence of shades, with values and units in the key.
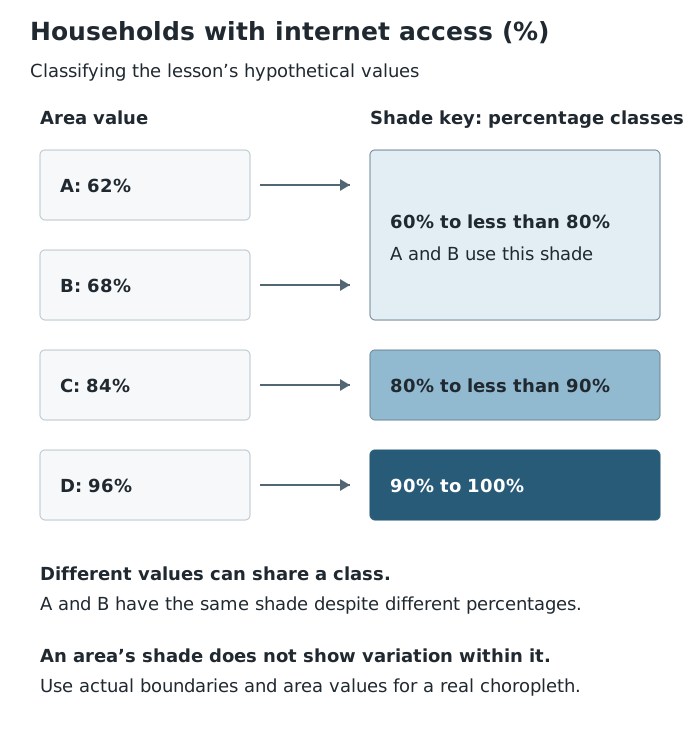
A and B have different values but the same shade. Shading communicates a class, not an exact value or every household's circumstances.
Suppose the four areas in this demonstration have internet-access rates of 62%, 68%, 84% and 96%. The first two belong in the same class even though their values differ. The darkest area has the highest class, but its shading does not show whether every neighbourhood within it has equally good access. This is how the method transfers to real data: use actual area boundaries and values, classify each value with the key, and avoid treating an area-wide figure as a description of every household.
Extracting means taking a specific fact from the map, such as a grid reference, a distance or a value class. Interpreting means explaining what that information means. Analysing means identifying relationships and patterns: look for clusters, gradual changes and areas that differ from their neighbours.
Build a description from the overall pattern to supporting detail. For example, describe where higher values are concentrated, compare them with lower-value areas, and identify exceptions. Use compass directions, named locations or grid references to make the description precise.
Evaluating means judging how useful and reliable the map is for the question. Check what is being measured, its units and date, the level of detail, and what has been left out. Broad choropleth classes can hide differences, and large areas can dominate the visual impression. A sketch map is clear because it omits detail, but those omissions limit the questions it can answer.
Finally, distinguish a pattern from an explanation. A map may reveal that two features occur together, but it does not automatically establish why. Additional evidence is needed to test an explanation. The strongest conclusion states what the mapped information supports and recognises its limits.
Select relevant features → frame and positioning grid → simple features → title, orientation, scale and key → explanatory annotations.
Preserve relative positions. Adjust the scale if the map changes size.
Read eastings before northings. For a four-figure reference, use the bottom-left corner of the square.
A six-figure reference contains three easting digits followed by three northing digits: 625333, not 623335.
Keep map and ground distances in the same units when using a ratio scale.
Check whether a question asks for straight-line distance or distance along a route.
Support a spatial pattern with locations and values, then identify any exceptions.
An annotation should add information or explanation, rather than simply name a feature.
It can see this note and what your specification asks for.
Answers are free with an account.
1 free note left this week
Get more free notesYour answer sets when this note comes back for review, or marks it complete.
Was this note helpful?
Log in to tell us whether it helped, or to report a problem.
Last updated
Map scale
The relationship between a distance on a map and the corresponding distance on the ground.
Key
The explanation of the symbols, colours and shading used on a map.
Easting
A numbered vertical grid line whose value increases towards the east.
Northing
A numbered horizontal grid line whose value increases towards the north.
Four-figure grid reference
A reference containing two easting digits followed by two northing digits, identifying a grid square.
Six-figure grid reference
A reference containing three easting digits followed by three northing digits, locating a position to a precision of 100 metres on the OS National Grid.
Sketch map
A simplified map that selects the features relevant to a particular purpose.
Annotation
A note attached to a map feature that adds detail or explanation.
Flow line map
A map using lines of different widths to represent the amounts moving between places.
Choropleth map
A map using different shades or colours to show numerical classes for geographical areas.
Spatial pattern
The arrangement of features or values across an area, such as a cluster or a gradual change.
Put your knowledge into practice — try past paper questions for Geography A
Map scale
The relationship between a distance on a map and the corresponding distance on the ground.
Key
The explanation of the symbols, colours and shading used on a map.
Easting
A numbered vertical grid line whose value increases towards the east.
Northing
A numbered horizontal grid line whose value increases towards the north.
Four-figure grid reference
A reference containing two easting digits followed by two northing digits, identifying a grid square.
Six-figure grid reference
A reference containing three easting digits followed by three northing digits, locating a position to a precision of 100 metres on the OS National Grid.
Sketch map
A simplified map that selects the features relevant to a particular purpose.
Annotation
A note attached to a map feature that adds detail or explanation.
Flow line map
A map using lines of different widths to represent the amounts moving between places.
Choropleth map
A map using different shades or colours to show numerical classes for geographical areas.
Spatial pattern
The arrangement of features or values across an area, such as a cluster or a gradual change.