

Loading…
Loading…
Loading…
OCR GCSE Combined Science B · J260
OCR J260 · Data Presentation and Evaluation Check the specification (PDF) (opens in a new tab)
A table preserves individual readings, but a graph makes their relationship easier to see. It can reveal whether one quantity increases as another increases, whether the rate of change stays constant, or whether the relationship levels off. Choosing and drawing the graph carefully is part of analysing the evidence, not just presenting it neatly.
First consider the type of variable. Use a bar chart to compare separate categories, such as the temperature changes produced by different metals. Label the categories and draw equal-width bars with consistent gaps between them. Bar charts can also represent discrete numerical values. For two quantities measured on continuous numerical scales, such as volume and time, plot points on numerical axes and draw an appropriate line or curve. A histogram shows the distribution of continuous data grouped into intervals; its bars touch. A pie chart shows how a whole is divided between categories.
In an investigation, the independent variable is the quantity deliberately changed; it normally goes on the horizontal, or , axis. The dependent variable is the quantity measured in response; it normally goes on the vertical, or , axis. For volume collected over time, time goes horizontally and volume vertically.
Label each axis with both the quantity and its unit, for example ‘Time (s)’ and ‘Volume (cm³)’. Choose evenly spaced numerical scales that cover the data and let the points occupy at least half the available grid in each direction. Useful scales have large divisions representing 1, 2 or 5 multiplied by a power of ten. The two axes do not need the same scale. An axis need not start at zero if a different starting value makes the pattern clearer, but its numbering must make this clear.
Read the value represented by each small division before plotting. If five small divisions represent 10 seconds, each represents 2 seconds. Plot each pair of values as a small, precise cross so that its centre can be read accurately. Give the graph an informative title.
Suppose water is collected from a steady flow. The graph and the table beneath it show example volumes collected at five times, allowing us to explore how to construct and analyse a graph.
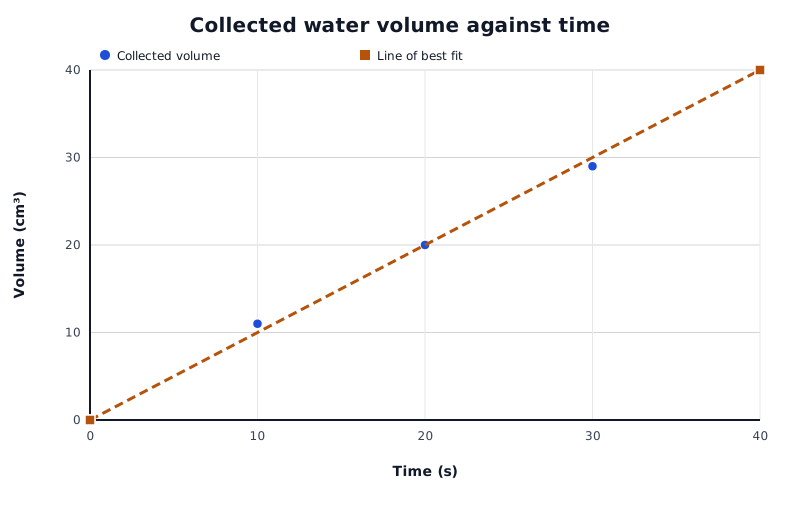
The fitted line summarises the near-linear pattern. Read estimates and calculate gradients from this line rather than from individual scattered points.
Data for Collected water volume against time
| Series | Time (s) | Volume (cm³) |
|---|---|---|
| Collected volume | 0 | 0 |
| Collected volume | 10 | 11 |
| Collected volume | 20 | 20 |
| Collected volume | 30 | 29 |
| Collected volume | 40 | 40 |
| Line of best fit | 0 | 0 |
| Line of best fit | 40 | 40 |
The points follow an approximately straight-line pattern. The fitted line represents the overall relationship rather than the small differences between individual readings.
A line of best fit passes through or close to the plotted points, with a reasonable balance of points on either side. Draw a single straight line with a ruler when the pattern is linear. If the pattern bends, draw a smooth curve instead. A best-fit line does not normally join every point with short straight segments: that would turn small variations between readings into apparent changes in the relationship.
A fitted line is appropriate when it represents a predictable relationship between readings. Sometimes that is not justified. For example, blood sugar measurements taken several minutes apart could miss a peak between readings. Joining those readings with straight segments displays the recorded changes without claiming a smooth, predictable relationship between them.
Describe the pattern in terms of the quantities on the axes. In the water example, the collected volume increases approximately steadily with time, from 0 cm³ at 0 s to 40 cm³ at 40 s. A straight rising line has a constant positive gradient. A falling line has a negative gradient, while a horizontal line has zero gradient.
For a curve, describe how its steepness changes. A rising curve that becomes less steep shows that the vertical-axis quantity is still increasing, but by smaller amounts for equal increases in the horizontal-axis quantity. A horizontal section means that the vertical-axis quantity is no longer changing.
Direct proportion is a more specific relationship than simply ‘increasing together’: its graph is a straight line through the origin. A straight line with a non-zero intercept is linear, but does not show direct proportion.
Repeat readings often differ. The mean gives a central value, while the range describes their spread:
Suppose three measurements of collected volume at 20 s are 18 cm³, 20 cm³ and 22 cm³. Their mean is , and their range is . The range may also be stated as ‘from 18 to 22 cm³’. The mean summarises the readings, but it does not show that they differed by as much as 4 cm³.
To display both pieces of information, plot the mean at 20 cm³ and draw a vertical range bar from 18 cm³ to 22 cm³ at the same time value. Its full length represents the range of the repeat readings. Longer range bars show greater spread among the repeats, indicating greater uncertainty associated with that variation. Always establish what an uncertainty bar represents before interpreting it.
To obtain a volume for a chosen time, move vertically from the time axis to the fitted line, then horizontally to the volume axis. Reverse this process to find a time for a chosen volume.
On the fitted line in the example, 25 s corresponds to about 25 cm³. This is interpolation: the estimate lies within the measured time range, between plotted readings. Use the fitted line rather than selecting whichever individual point is nearest.
Extrapolation means extending the relationship beyond the collected data. Extending this line to 50 s predicts 50 cm³. That prediction assumes the flow continues at the same rate. If it slows or stops, the prediction will fail. Extrapolation is therefore less secure than interpolation, especially far beyond the measured range. Normally draw a fitted line only across the measured range; extend it when making a justified prediction.
A gradient measures how much the vertical-axis quantity changes for each unit increase in the horizontal-axis quantity:
For a straight best-fit line, choose two widely separated positions on the line. They need not be original data points. Draw a large right-angled triangle, with the fitted line as its diagonal, a horizontal side showing and a vertical side showing . The triangle should cover at least half the fitted line. Mark the coordinates where it meets the line. A larger triangle reduces the effect of small reading errors.
The fitted water-volume line passes through (0 s, 0 cm³) and (40 s, 40 cm³). Its gradient is . This means that the collected volume increases by 1 cm³ each second: here, the gradient represents the volume flow rate. What a gradient means always depends on the quantities and units on the axes.
A curve does not have one constant gradient. To find its gradient at a particular point, draw a tangent with the same slope as the curve at that point. Place a ruler at the point and adjust its angle until it follows the curve's local direction, then draw the straight tangent. Choose two widely separated positions on the tangent and calculate using a large triangle. This gives the rate of change at that point, rather than an average over a whole interval.
Check whether the horizontal-axis variable is a category or a continuous quantity before choosing a graph.
Use a sharp pencil, clearly labelled axes and a scale with easily read intervals such as 1, 2 or 5.
Do not force a best-fit line through the origin unless the data and scientific relationship justify it.
For a gradient, show the coordinates, subtraction and division. Choose widely separated points on the line, not two scattered data points.
Give gradient units as vertical-axis units divided by horizontal-axis units.
Describe trends with figures from the data, rather than writing only ‘it increases’.
It can see this note and what your specification asks for.
Answers are free with an account.
1 free note left this week
Get more free notesYour answer sets when this note comes back for review, or marks it complete.
Was this note helpful?
Log in to tell us whether it helped, or to report a problem.
Last updated
Categoric variable
A variable whose values are separate named groups rather than positions on a numerical scale, such as the type of metal.
Continuous variable
A variable that can take any value within a range, such as time or temperature.
Mean
The sum of the values in a data set divided by the number of values.
Range
The largest value in a data set minus the smallest value. A range can also be stated by giving its minimum and maximum values.
Range bar
A line drawn through a plotted position from the smallest to the largest repeat reading, showing their spread as an indication of uncertainty.
Line of best fit
A straight line or smooth curve that represents the overall pattern of plotted data.
Gradient
The change in the vertical-axis quantity divided by the corresponding change in the horizontal-axis quantity: .
Interpolation
Estimating a value within the range of the collected data using a line or curve.
Extrapolation
Estimating a value beyond the range of the collected data by extending a line or curve.
Tangent
A straight line that touches a curve at a chosen point and has the same slope as the curve there.
Put your knowledge into practice — try past paper questions for Combined Science B
Categoric variable
A variable whose values are separate named groups rather than positions on a numerical scale, such as the type of metal.
Continuous variable
A variable that can take any value within a range, such as time or temperature.
Mean
The sum of the values in a data set divided by the number of values.
Range
The largest value in a data set minus the smallest value. A range can also be stated by giving its minimum and maximum values.
Range bar
A line drawn through a plotted position from the smallest to the largest repeat reading, showing their spread as an indication of uncertainty.
Line of best fit
A straight line or smooth curve that represents the overall pattern of plotted data.
Gradient
The change in the vertical-axis quantity divided by the corresponding change in the horizontal-axis quantity: .
Interpolation
Estimating a value within the range of the collected data using a line or curve.
Extrapolation
Estimating a value beyond the range of the collected data by extending a line or curve.
Tangent
A straight line that touches a curve at a chosen point and has the same slope as the curve there.
A range can also be quoted using its minimum and maximum. Describe direction, changing steepness and any plateau; support the pattern with values. Direct proportion requires a straight line through the origin.
Use a triangle covering at least half the fitted line and two positions on that line. For a curve's gradient at one point, use a tangent. Interpret the gradient using the axis quantities and units.