

Loading…
Loading…
Loading…
OCR GCSE Combined Science B · J260
OCR J260 · Data Presentation and Evaluation Check the specification (PDF) (opens in a new tab)
Scientific data need to be recorded clearly before they can be processed or used as evidence. A reader should be able to tell what was observed, what was measured and what each number means.
Qualitative data describe observations: for example, a solution changes colour or a white precipitate forms. A precipitate is an insoluble solid formed in a solution. Quantitative data are numerical, such as a mass or a temperature. A record can contain both types: an observation of a colour change alongside the temperature at which it occurred.
A table is useful for organising exact measurements and written observations. Prepare it before collecting data, with enough space for every reading and any repeats. Use informative descriptions such as ‘white precipitate’, rather than a vague comment such as ‘something happened’.
In an investigation, the independent variable is the factor you change, and the dependent variable is the factor you measure in response. Usually, put the independent variable in the first column and the dependent measurements in the following columns. Give numerical headings both a quantity and a unit, such as ‘Time / s’. The cells beneath then contain numbers, without repeated units.
Different representations make different features of data easier to see. A table preserves individual readings; a graph makes their relationship easier to inspect; a written description communicates the relevant observations. Changing representation should preserve the values, units and meaning of the data.
Suppose you are practising with these temperature readings:
| Time / s | Temperature / °C |
|---|---|
| 0 | 20.0 |
| 30 | 25.0 |
| 60 | 30.0 |
| 90 | 35.0 |
To transfer them to a graph, treat each row as a pair of coordinates. The row containing 30 and 25.0 becomes a point at a time of 30 s and a temperature of 25.0 °C. Time goes on the horizontal axis and temperature on the vertical axis.
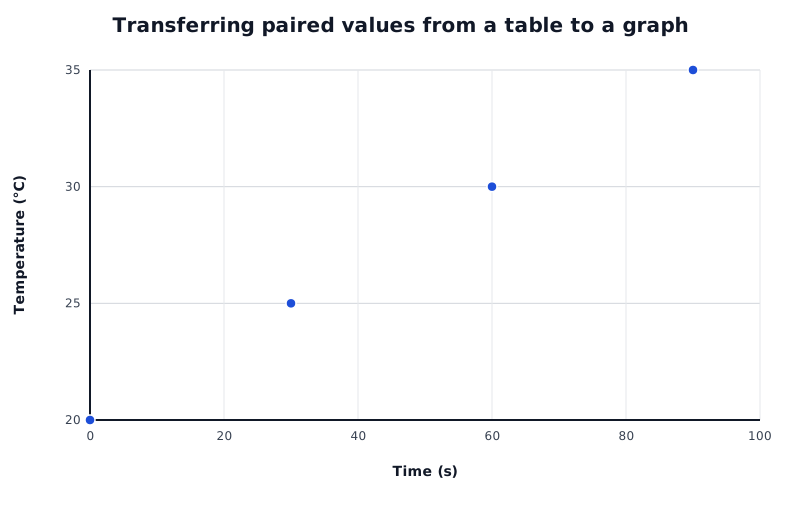
Each row of the practice table becomes one point: time is the horizontal coordinate and temperature is the vertical coordinate.
Data for Transferring paired values from a table to a graph
| Series | Time (s) | Temperature (°C) |
|---|---|---|
| Practice temperature readings | 0 | 20 |
| Practice temperature readings | 30 | 25 |
| Practice temperature readings | 60 | 30 |
| Practice temperature readings | 90 | 35 |
To transfer a plotted point back to a table, read its horizontal coordinate and vertical coordinate, then place each value in the correct column. A written statement such as ‘At 60 s, the temperature was 30.0 °C’ expresses the same pair of values in words.
For numerical measurements of two changing quantities, plotted points are useful. If instead you are comparing a numerical measurement across separate categories, a bar chart may be appropriate. Written qualitative observations are often clearest in a table. The choice depends on the information, not simply on which format looks most attractive.
A measurement combines a number with a unit. ‘Mass = 5’ is incomplete; ‘Mass = 5 g’ tells the reader what the number represents.
The International System of Units, or SI, provides standard units so measurements can be understood and compared consistently. Use SI units and suitable multiples or fractions where appropriate. Examples include kilograms, grams and milligrams for mass; kilometres, metres and millimetres for length; and kilojoules or joules for energy.
Choose the unit that matches the quantity. Length can be expressed in metres, area in square metres and volume in cubic metres. A speed in m/s means metres travelled per second. In a calculation, the values must use units compatible with the equation: for example, distance in metres divided by time in seconds gives speed in m/s.
A unit prefix changes the size of a unit by a power of ten. The same prefix has the same meaning wherever it is used: kilo means one thousand, so both a kilometre and a kilojoule contain one thousand of the unprefixed unit.
| Prefix | Symbol | Factor |
|---|---|---|
| tera | T | |
| giga | G | |
| mega | M |
Positive powers describe multiples: . Negative powers describe fractions: . Thus, 1 mg is 0.001 g, while 1 kg is 1000 g.
Powers of ten also describe orders of magnitude. A factor of ten is one order of magnitude; a factor of one thousand is three orders of magnitude.
Standard form makes very large or small numbers easier to handle. For example, , while . For a positive number, the first factor must be at least 1 and less than 10. On a scientific calculator, a key labelled EXP or usually enters the power-of-ten part; its exact operation depends on the model.
Converting units changes how a quantity is written, not the quantity itself. The same length has a larger numerical value when expressed using smaller units.
Start with the relationship between the units. Since , multiply a value in metres by 1000 to express it in millimetres; divide by 1000 to reverse the conversion. Similarly:
You can also convert directly between prefixes. A millimetre is m and a micrometre is m, so a millimetre contains micrometres. Therefore, .
For areas, the conversion applies in two directions. Since 1 cm is 10 mm, a square measuring 1 cm by 1 cm measures 10 mm by 10 mm. Therefore, . For volumes, the length conversion factor is cubed because there are three dimensions.
Clear data labels must identify the substance as well as the measurement. IUPAC nomenclature is an internationally agreed system for naming chemicals. It helps avoid ambiguous labels such as ‘salt’ or ‘iron compound’.
Use familiar systematic names and correct formulae: NaCl is sodium chloride, and CaCO₃ is calcium carbonate. For these ionic compounds, name the positive ion first and the negative ion second.
Sometimes a Roman numeral is needed to distinguish substances. FeCl₂ is iron(II) chloride, whereas FeCl₃ is iron(III) chloride. Calling both ‘iron chloride’ loses important information. Molecular names can also distinguish composition: CO is carbon monoxide and CO₂ is carbon dioxide.
Use systematic nomenclature unless it is inappropriate. Familiar accepted names still have a place: H₂O is normally called water.
Calculator displays often contain more digits than measurements justify. Significant figures communicate the precision with which a value is reported.
Count from the first non-zero digit. Leading zeros do not count, but zeros between significant digits do. Trailing zeros after a decimal point can also be significant: 35.0 has three significant figures, while 35 has two. Decimal places are different: they count digits after the decimal point, regardless of where the first non-zero digit occurs.
To round, retain the required significant digits and inspect the next digit. If it is 5 or more, round up; if it is less than 5, leave the retained digit unchanged. For example, rounded to two significant figures is . The zero must remain because it shows that two significant figures are being reported.
For multiplication and division of measured values, a usual guide is to give the answer to the same number of significant figures as the input with the fewest significant figures. Exact conversion factors do not limit this precision. Retain extra digits while calculating, then round once at the end, following any precision specifically requested in the question.
Use appropriate SI and compatible units in calculations.
Put the quantity and unit in each numerical table heading, rather than repeating the unit in every cell.
Check the required unit before substituting values into an equation. Converting to a smaller unit makes the numerical value larger.
Prefix symbols are case-sensitive: M means mega, while m means milli.
For area and volume conversions, square or cube the length conversion factor.
Keep extra digits during a calculation and round the final answer. Do not confuse significant figures with decimal places.
Use systematic chemical names where appropriate, but retain familiar accepted names such as water.
It can see this note and what your specification asks for.
Answers are free with an account.
1 free note left this week
Get more free notesYour answer sets when this note comes back for review, or marks it complete.
Was this note helpful?
Log in to tell us whether it helped, or to report a problem.
Last updated
Data
Information collected through observations or measurements.
Qualitative data
Descriptive information, such as a colour change or the formation of a solid, rather than a numerical measurement.
Quantitative data
Numerical information, such as a measured mass, temperature or time.
Unit
An agreed measurement standard used to express a quantity, such as the metre for length.
SI
The International System of Units: a standard system of measurement units used to communicate scientific quantities consistently.
Unit prefix
A symbol or word placed before a unit to indicate a power-of-ten multiple or fraction of that unit.
Standard form
A way of writing a non-zero number as , where and is an integer.
Order of magnitude
A factor-of-ten scale used to describe the size of a quantity. A difference of one order of magnitude corresponds to a factor of ten.
Significant figure
A digit counted when expressing the precision of a numerical value, starting from its first non-zero digit.
IUPAC nomenclature
An internationally agreed system of chemical naming developed by the International Union of Pure and Applied Chemistry.
Put your knowledge into practice — try past paper questions for Combined Science B
Data
Information collected through observations or measurements.
Qualitative data
Descriptive information, such as a colour change or the formation of a solid, rather than a numerical measurement.
Quantitative data
Numerical information, such as a measured mass, temperature or time.
Unit
An agreed measurement standard used to express a quantity, such as the metre for length.
SI
The International System of Units: a standard system of measurement units used to communicate scientific quantities consistently.
Unit prefix
A symbol or word placed before a unit to indicate a power-of-ten multiple or fraction of that unit.
Standard form
A way of writing a non-zero number as , where and is an integer.
Order of magnitude
A factor-of-ten scale used to describe the size of a quantity. A difference of one order of magnitude corresponds to a factor of ten.
Significant figure
A digit counted when expressing the precision of a numerical value, starting from its first non-zero digit.
IUPAC nomenclature
An internationally agreed system of chemical naming developed by the International Union of Pure and Applied Chemistry.
| kilo | k |
| centi | c |
| milli | m |
| micro | µ |
| nano | n |
| Prefix | Symbol | Factor |
|---|---|---|
| tera | T | |
| giga | G | |
| mega | M | |
| kilo | k | |
| centi | c | |
| milli | m | |
| micro | µ | |
| nano | n |