

Loading…
Loading…
Loading…
OCR GCSE Combined Science B · J260
OCR J260 · Data Presentation and Evaluation Check the specification (PDF) (opens in a new tab)
A clear pattern is only the beginning of a scientific conclusion. Before deciding what results mean, we need to ask how well the measurements were made, whether the pattern can be obtained again, and whether errors could explain it.
Consider an investigation into light intensity at different distances from a lamp. A prediction is that light intensity decreases as distance increases. Measurements might support this prediction, but a convincing evaluation must consider both the pattern and the quality of the evidence behind it.
Accuracy describes how close a result is to the true or accepted value. If a reference mass is 100 g and a balance reads 108 g, that reading is inaccurate.
Precision describes how closely repeated measurements agree. Suppose the balance gives readings of 108 g, 108 g and 109 g for that reference mass. These readings are close together, so they are precise, but they are not accurate. Consistency alone does not show that a measurement is correct.
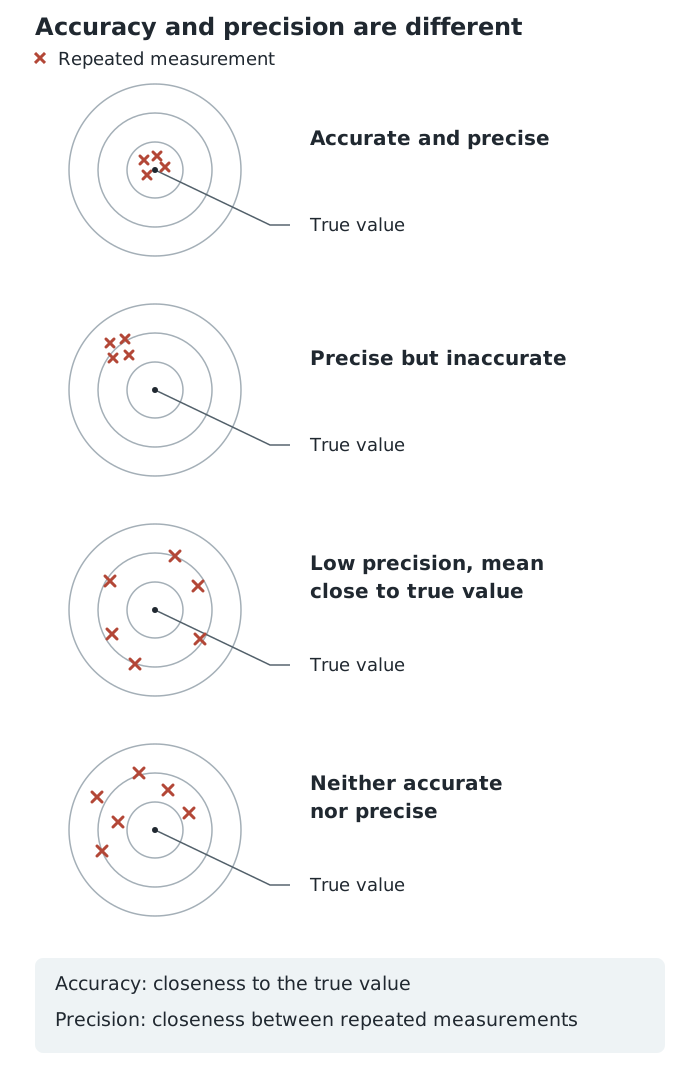
Closeness to the true value and closeness between repeats are different properties of measurements.
On the diagram, distance from the centre represents error relative to the true value, while the spread of the marks represents precision. A tight cluster away from the centre shows why precise results can still be inaccurate.
To assess accuracy, compare a measurement with a suitable accepted value or check the instrument against a known standard. Small scatter around a line of best fit shows consistency with the pattern, but it does not establish accuracy: all readings could share the same bias.
Results are repeatable when the same investigator obtains closely agreeing measurements using the same method and equipment. Repeating measurements at each lamp distance allows this to be assessed. Small ranges between repeats, shown by short range bars on a graph, provide evidence of good repeatability.
Results are reproducible when different investigators, or different equipment or methods, produce agreeing results. For example, another group could investigate the same lamp distances using a different light meter. Agreement would strengthen confidence that the findings are not peculiar to one instrument or investigator.
These are different tests. One student taking many similar readings demonstrates repeatability, not necessarily reproducibility. Both can be good even when a shared flaw makes measurements inaccurate.
A random error causes unpredictable variation between readings. In the lamp investigation, slight changes in the sensor's position or fluctuating background light could make some readings higher and others lower. This increases scatter and reduces precision.
Repeating measurements and calculating a mean reduces the influence of random variation on the final estimate. It does not remove the cause of that variation or guarantee that the estimate is accurate.
A systematic error shifts measurements consistently in a particular direction. For example, measuring every distance from the wrong reference point would give consistently incorrect distances. A light meter with an incorrect zero could consistently over-read.
Repeating the same flawed measurement does not correct a systematic error. The reference point must be corrected, or the instrument checked and adjusted. A useful evaluation therefore identifies a specific possible error rather than simply blaming ‘human error’.
An outlier is a result that is unusually different from other readings or from the general pattern. It is a reason to investigate, not an automatic reason to delete data.
In a set of light-intensity measurements, the first three readings at 10 cm were 301.56, 305.53 and 300.65 lux. Elsewhere in the same row there was a reading of 134.13 lux. This much lower reading deserves investigation. However, the first three columns belonged to one investigator, so the whole row should not automatically be treated as repeats by that person under identical conditions.
Check the recording, instrument and experimental conditions, then repeat the measurement if possible. A sensor temporarily shaded by someone's hand would be a plausible explanation for an unusually low reading, but it should not be claimed as the cause without evidence.
Excluding a reading can be justified if there is evidence of a mistake or a condition that invalidated the measurement. Record the original result and explain why it was excluded. If no such evidence exists, retaining it and discussing its effect on the mean and uncertainty may be more appropriate. A genuine unexpected result can reveal a weakness in the hypothesis rather than a fault in the data.
An improvement is useful when its benefit is explained. For the light investigation:
If using a lamp, avoid touching a hot bulb and allow it to cool before adjusting it. Keep electrical leads away from walkways so they do not create a trip hazard.
Further investigation should answer a remaining question. More closely spaced distances could explore where the intensity changes most rapidly. Repeating the investigation with another lamp could test whether the same decreasing pattern occurs with a different light source. Neither is simply a substitute for correcting an existing measurement error.
Data may appear as numbers, a graph, an apparatus diagram or symbols. Start by identifying what each value, axis, label or symbol represents, including its unit. An apparatus diagram can reveal a possible measurement problem, such as an unclear distance reference point; a graph can reveal a trend or unusually scattered readings.
In the light investigation, one investigator's first three readings were about 301–306 lux at 10 cm and about 186–190 lux at 40 cm. These numerical observations support the inference that light intensity decreases as distance increases. On a graph, the same relationship would appear as a downward trend. Several distances provide stronger evidence for a pattern than one pair of readings.
A reasoned conclusion links the claim to evidence and acknowledges limitations: ‘Light intensity decreased as distance increased over the distances tested. Closely agreeing repeats strengthen confidence in this trend, although checking the meter's calibration would be needed to assess measurement accuracy.’
Confidence increases when results match a prediction, repeats agree, other investigators obtain similar findings, and plausible measurement errors have been addressed. Confidence decreases when results repeatedly contradict the prediction, show substantial unexplained scatter, or depend on a flawed method.
Uncertain data may be inconclusive rather than evidence that a hypothesis is wrong. Equally, agreement with a prediction does not prove a hypothesis: the investigation covers only particular conditions, and another explanation may also fit the observations. State how strongly the evidence supports the claim, and limit the conclusion to what was actually tested.
Use ‘repeatable’, ‘reproducible’ or ‘confidence’ rather than the vague claim that results are ‘reliable’.
Support evaluations with evidence: quote the spread of repeats, a comparison with an accepted value, or agreement between investigators.
More repeats do not correct a systematic error. Explain which error an improvement addresses and how it improves data quality.
Do not discard a result simply because it disagrees with your prediction. Give evidence for your decision.
Describe the overall pattern, then use selected values with units to support it. Keep your conclusion consistent with the limitations you identify.
It can see this note and what your specification asks for.
Answers are free with an account.
1 free note left this week
Get more free notesYour answer sets when this note comes back for review, or marks it complete.
Was this note helpful?
Log in to tell us whether it helped, or to report a problem.
Last updated
Accuracy
How close a measured result is to the true or accepted value of the quantity being measured.
Precision
The closeness of agreement between repeated measurements; precise measurements have little spread.
Repeatability
Agreement between results when the same investigator repeats measurements using the same method and equipment.
Reproducibility
Agreement between results obtained by different investigators, or using different equipment or methods.
Random error
Unpredictable variation in measurements that causes readings to scatter above and below their expected value.
Systematic error
An error that consistently shifts measurements in a particular direction, for example because an instrument has an incorrect zero.
Outlier
A result that is unusually different from other results or from the general pattern; also called an anomalous result.
Inference
A conclusion reached by reasoning from observations or data, rather than something directly observed.
Hypothesis
A proposed explanation that can be tested by collecting evidence.
Uncertainty
An indication of the doubt associated with a measurement; repeated readings can help reveal its likely spread.
Put your knowledge into practice — try past paper questions for Combined Science B
Accuracy
How close a measured result is to the true or accepted value of the quantity being measured.
Precision
The closeness of agreement between repeated measurements; precise measurements have little spread.
Repeatability
Agreement between results when the same investigator repeats measurements using the same method and equipment.
Reproducibility
Agreement between results obtained by different investigators, or using different equipment or methods.
Random error
Unpredictable variation in measurements that causes readings to scatter above and below their expected value.
Systematic error
An error that consistently shifts measurements in a particular direction, for example because an instrument has an incorrect zero.
Outlier
A result that is unusually different from other results or from the general pattern; also called an anomalous result.
Inference
A conclusion reached by reasoning from observations or data, rather than something directly observed.
Hypothesis
A proposed explanation that can be tested by collecting evidence.
Uncertainty
An indication of the doubt associated with a measurement; repeated readings can help reveal its likely spread.
Small scatter supports precision and repeatability, not necessarily accuracy.
Check the recording and conditions; repeat if possible. Exclude only with justification, preserving the original record. Otherwise retain and discuss the effect on the conclusion.
Identify what the data represent → describe the overall pattern → support it with values and units → draw an inference → state limitations.
Agreement with predictions, repeatability and reproducibility increase confidence. Contradictory results, unexplained scatter and method flaws decrease it. Uncertain evidence may be inconclusive; supporting evidence does not prove a hypothesis.