

Loading…
Loading…
Loading…
OCR GCSE Combined Science B · J260
OCR J260 · Scientific Models and Theories Check the specification (PDF) (opens in a new tab)
A correlation is a pattern of association between two variables. Variables are quantities or characteristics that can differ, such as body mass index (BMI) and blood cholesterol concentration. A correlation describes what tends to happen across a set of observations, rather than what must happen in every case.
A positive correlation means that higher values of one variable tend to occur with higher values of the other. A negative correlation means that higher values of one tend to occur with lower values of the other. If there is no clear pattern, the data show no clear correlation.
You can recognise these relationships in different forms. In a text, ‘People with higher BMI tend to have higher blood cholesterol’ describes a positive correlation. In a table, compare paired values or outcome frequencies across groups. In a scatter graph, each point represents a pair of values: an upward trend suggests positive correlation, a downward trend suggests negative correlation, and a scattered cloud without a trend suggests no clear correlation.
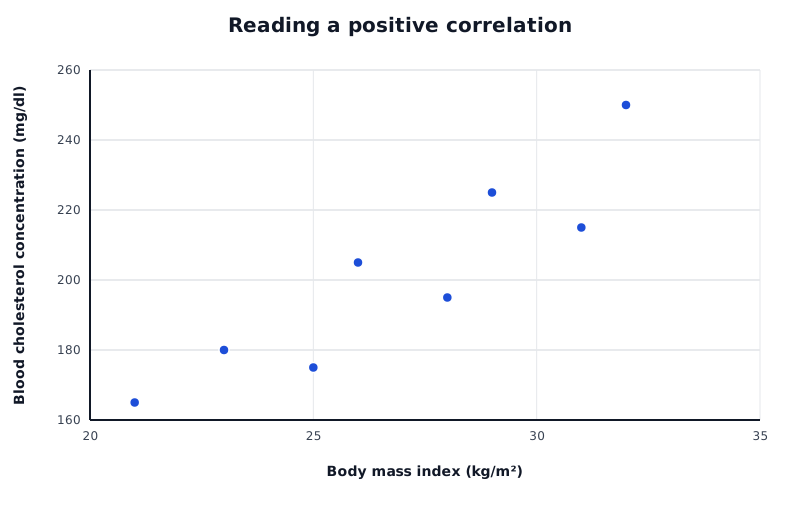
Example values showing an overall positive correlation between BMI and blood cholesterol, despite variation between individual points.
Data for Reading a positive correlation
| Series | Body mass index (kg/m²) | Blood cholesterol concentration (mg/dl) |
|---|---|---|
| Example paired values | 21 | 165 |
| Example paired values | 23 | 180 |
| Example paired values | 25 | 175 |
| Example paired values | 26 | 205 |
| Example paired values | 28 | 195 |
| Example paired values | 29 | 225 |
| Example paired values | 31 | 215 |
| Example paired values | 32 | 250 |
These example points show how to read a positive correlation. Moving from left to right, cholesterol concentration generally rises as BMI rises. However, it does not rise at every step. That variation does not erase the overall pattern. The relationship between BMI and cholesterol observed in groups of people is a correlation; the graph alone does not explain why it occurs.
Causation means that a factor brings about, or contributes to, an outcome. A correlation can suggest a possible cause-effect link, but cannot establish that link by itself. Scientists must propose and test an explanation: an explanation does not emerge automatically from a pattern of points.
For example, ice cream sales and hay fever cases can both increase during summer. This does not mean that eating ice cream causes hay fever. Summer conditions encourage ice cream purchases, while increased pollen exposure is associated with more hay fever. The season helps explain why the two quantities rise together.
Another variable that could explain an apparent relationship is called a confounding factor. When assessing a causal claim, ask whether the proposed factor really affects the outcome or whether another factor could account for the pattern. A controlled investigation, where other relevant variables are kept constant, can help distinguish these possibilities.
A risk factor is a characteristic, behaviour or exposure associated with an increased chance of an outcome. Smoking increases the risk of lung cancer, but not every smoker develops lung cancer. People who have never smoked can also develop it: other exposures, such as asbestos, can increase their risk.
Suppose a study followed two groups over the same period and recorded the following results. These are example numbers for practising interpretation, not results from a real study.
| Group | Number of people | Number who developed lung cancer |
|---|---|---|
| Smokers | 100 | 20 |
| Non-smokers | 100 | 5 |
Because the groups are the same size, their counts can be compared directly. Lung cancer occurred more frequently in the smokers, supporting an association between smoking and increased risk. Yet 80 smokers did not develop lung cancer, and five non-smokers did. Increased likelihood is compatible with both kinds of individual outcome.
Other examples of risk factors include obesity for Type 2 diabetes and lack of exercise for coronary heart disease. Several factors can act together, so a person's outcome need not depend on one factor alone.
‘My relative smoked and never developed lung cancer’ does not disprove the correlation. The claim concerns an increased chance, not a guaranteed outcome. Likewise, one smoker developing lung cancer does not establish a correlation: the disease might also occur without smoking.
A single case gives no useful comparison of how frequently the outcome occurs with and without the factor. Evidence from groups allows that comparison and reveals patterns that individual differences can hide. Individual cases can prompt questions, but they do not provide convincing evidence for or against a correlation.
A plausible mechanism is a scientifically credible process explaining how a factor could produce an outcome. For smoking and lung cancer, carcinogenic substances in tobacco smoke can damage DNA in cells. Changes affecting the control of cell division can lead to uncontrolled division and cancer. This mechanism gives a reason to accept smoking as a cause contributing to lung cancer, rather than merely a correlated behaviour.
By contrast, the correlation between ice cream sales and hay fever does not supply a credible mechanism by which ice cream produces hay fever. The seasonal explanation provides a better account of the pattern, giving reasonable grounds for rejecting that causal claim.
A mechanism strengthens a causal explanation, especially when it agrees with evidence from investigations. However, a plausible story alone is not proof. Equally, failure to identify a mechanism weakens a causal claim but does not demonstrate that no mechanism exists. A justified conclusion weighs the observed pattern, alternative explanations and evidence for the proposed process.
A pattern can suggest a cause-effect link, but correlation alone does not establish . Another factor may explain both variables: summer links increased ice cream sales with increased hay fever cases.
Describe a correlation using both variable names: ‘As X increases, Y tends to increase/decrease.’ Support the pattern with figures and units when available.
Do not turn ‘increases the chance’ into ‘always causes’. A risk factor need not produce the outcome in every individual.
When evaluating causation, explain how a proposed mechanism connects the factor to the outcome, and consider other factors that could explain the correlation.
One individual case cannot establish or overturn a population-level correlation. Compare outcome frequencies in groups.
It can see this note and what your specification asks for.
Answers are free with an account.
1 free note left this week
Get more free notesYour answer sets when this note comes back for review, or marks it complete.
Was this note helpful?
Log in to tell us whether it helped, or to report a problem.
Last updated
Correlation
A pattern of association between two variables: their values tend to vary together.
Positive correlation
A relationship in which higher values of one variable tend to occur with higher values of another.
Negative correlation
A relationship in which higher values of one variable tend to occur with lower values of another.
Causation
A cause-effect relationship in which a factor brings about, or contributes to, an outcome.
Plausible mechanism
A scientifically credible process explaining how a factor could produce an outcome.
Risk factor
A characteristic, behaviour or exposure associated with an increased chance of a particular outcome.
Confounding factor
Another variable that could explain an apparent relationship between the two variables being studied.
Put your knowledge into practice — try past paper questions for Combined Science B
Correlation
A pattern of association between two variables: their values tend to vary together.
Positive correlation
A relationship in which higher values of one variable tend to occur with higher values of another.
Negative correlation
A relationship in which higher values of one variable tend to occur with lower values of another.
Causation
A cause-effect relationship in which a factor brings about, or contributes to, an outcome.
Plausible mechanism
A scientifically credible process explaining how a factor could produce an outcome.
Risk factor
A characteristic, behaviour or exposure associated with an increased chance of a particular outcome.
Confounding factor
Another variable that could explain an apparent relationship between the two variables being studied.
Risk factors increase likelihood, not certainty. One person with or without an outcome cannot establish or disprove a correlation; compare frequencies across groups.
Look for a plausible mechanism, supporting evidence and alternative explanations. Carcinogens in tobacco smoke can damage DNA, leading to uncontrolled cell division: a mechanism supporting smoking as a cause of lung cancer. An absent mechanism weakens a claim; a proposed mechanism alone does not prove it.