

Loading…
Loading…
Loading…
Eduqas GCSE Geography B · C112
Eduqas C112 · 3.4 Check the specification (PDF) (opens in a new tab)
Describe locations, distributions, and spatial patterns derived from Geographic Information Systems (GIS) frameworks.
Interpret interactive maps and GIS screenshots to analyze geographical phenomena such as flood hazards or demographic statistics.
A geographic information system (GIS) is a computer system that captures, stores, analyses and displays information linked to geographical locations. This information is called geospatial data. A population percentage becomes geospatial data when it is linked to a particular neighbourhood; flood-risk information becomes geospatial data when it is linked to mapped areas.
GIS displays information in layers. A base map might show streets and place names, while separate layers show flood-risk zones and important buildings. Because these layers refer to the same locations, you can compare them: for example, you can identify whether a school lies within a flood-risk zone.
An interactive GIS lets you search, pan, zoom, select layers and sometimes click features to reveal information. A screenshot preserves only the view and layers selected at that moment. You must interpret what is visible rather than assume that information outside the screenshot has been checked.
Start with the title or selected topic: what is being mapped, where and when? Then read the legend to establish what the colours, symbols or dots mean. Check whether the values are numbers, percentages, risk categories or changes over time. Identify the mapped boundaries and use the orientation shown, rather than automatically assuming that the top is north. A scale bar helps you judge the distances involved.
Location, distribution and spatial pattern answer different questions:
Build a description from the general pattern to specific evidence. Then identify contrasts or exceptions. ‘High values are clustered in the north’ is more useful than simply naming every dark area.
Suppose a GIS displays six fictional neighbourhoods. The selected category is one-person households as a percentage of all households. The map uses three shades: 0–19%, 20–29% and 30–49%. North is at the top.
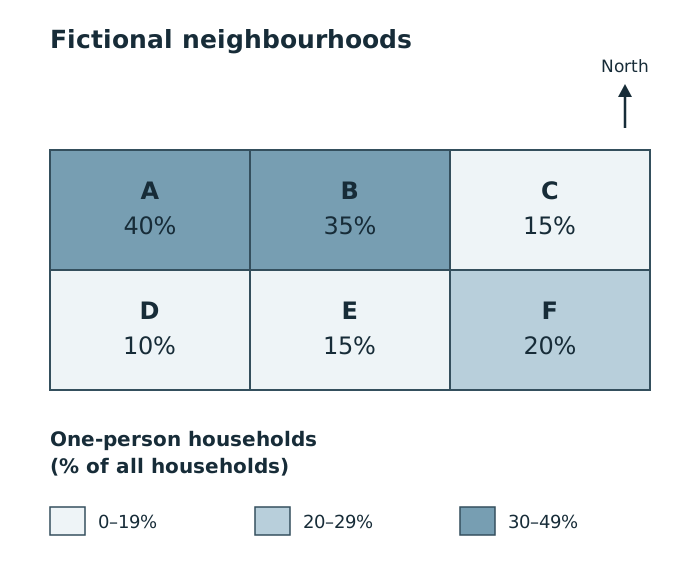
Compare the northern cluster of high percentages with the lower value immediately to its east. Shading represents a proportion of households in each whole neighbourhood.
Begin with the legend: the darkest shade means a higher proportion of one-person households, not necessarily more households in total. Neighbourhoods A and B have the highest percentages, at 40% and 35%. They are next to one another in the north-west and north-central parts of the mapped area. C, immediately to their east, has only 15%, so the high-value pattern does not extend across the whole northern row. D has the lowest percentage, at 10%, in the south-west.
A concise description would be: ‘The highest proportions of one-person households are concentrated in the north-west and north-central neighbourhoods, where values are 40% and 35%. Most other neighbourhoods have lower proportions of 10–20%, including the north-eastern neighbourhood.’
Interpretation takes this a step further. The pattern suggests that living alone is more common among households in A and B than in the other neighbourhoods. It does not establish why people live alone, or which individual homes contain one person. Nor can the percentages tell you which neighbourhood has the largest total number of one-person households without knowing the total household counts.
Transfer this method to an actual GIS screenshot by replacing the fictional labels with its named places and reading its own legend and boundaries. Real neighbourhoods differ in shape and size; the equal rectangles here demonstrate the reading method, not real geography.
The Office for National Statistics (ONS) Census maps display Census 2021 information for England and Wales, down to neighbourhood level. You can select a topic and category, search for an area or postcode, and zoom to examine local differences.
For a percentage map of one-person households, darker shading represents a higher percentage of households in that category. Compare areas using the same selected category and geographical level. The census date matters: these maps describe circumstances in March 2021, not necessarily the population today.
At some neighbourhood levels, the display uses building shapes to visualise the data. However, the values apply to the outlined statistical area, not to each building. ONS dot density maps also represent area-level information: the legend states how many people or households each dot represents, and dots are distributed within the area rather than locating individual residents.
Some ONS maps show change between the 2011 and 2021 censuses. Check the legend: a percentage-point change is the difference between two percentages, not a percentage increase or decrease. This changes how you interpret the map: a dark area might indicate a large change rather than a high current value.
Flood-risk GIS maps show where flooding could affect places, people and property. The Environment Agency provides flood-risk information for England; Natural Resources Wales provides it for Wales. Check the geographical coverage and the type of flooding represented before interpreting a layer.
A useful method is to view the whole settlement first, identify its extent and centre, then examine how the risk zones are distributed. Read the risk categories from the legend and describe them relative to rivers, named places and compass directions.
For example, a GIS demonstration of Keswick, in Cumbria in north-west England, shows flood-risk areas concentrated in the northern parts of the town close to the River Greta and on the western side. The town centre and south-eastern parts are less affected by the displayed risk zones. This is a spatial description: it links the distribution to directions and a named river rather than merely stating that Keswick has flood risk.
To interpret possible impacts, compare the flood-risk layer with buildings and land use. In an interactive GIS, switching layers off temporarily or increasing their transparency can reveal features hidden beneath shading. Changing the base map to satellite imagery can help distinguish residential areas from parkland; clicking an important-building symbol can reveal its function.
The Keswick demonstration identifies houses and a primary school within displayed flood-risk areas. This overlap suggests potential disruption to residents and education if flooding occurs. Emergency services can use such information to prepare for affected areas, while planners can consider whether proposed development would expose more people or property.
Keep the conclusion within the evidence. A building inside a risk zone is potentially exposed; the map alone does not show exactly when it will flood or how much damage it will suffer. A river-flood layer also cannot establish that places outside its zones are safe from every kind of flooding: surface-water flooding can occur away from rivers.
Check topic, place, date, legend, units, boundaries, orientation and scale. Identify the selected layers and what the screenshot actually covers.
Give the overall pattern → specific evidence → exceptions.
Compare layers or areas, then explain what their relationship suggests. Separate observed patterns from possible explanations.
Zoom and pan: explore location and detail. Layer selection: compare information. Transparency: reveal features below shading. Base-map choice: change the background reference. Click features: inspect available attributes.
Describe a pattern, not just a list of places: give the overall distribution, support it with locations or values, then identify any exception.
Use the legend to identify what colours represent. Darker shading does not always mean a larger number of people: it may show a higher percentage.
Keep description and interpretation distinct: first state what the map shows, then explain what the pattern suggests.
A flood-risk zone shows potential flooding, not proof that flooding is happening or will definitely happen.
Do not treat census shading or dots as information about an individual household, building or street.
It can see this note and what your specification asks for.
Answers are free with an account.
1 free note left this week
Get more free notesYour answer sets when this note comes back for review, or marks it complete.
Was this note helpful?
Log in to tell us whether it helped, or to report a problem.
Last updated
Geographic information system (GIS)
A computer system that captures, stores, analyses and displays data linked to geographical locations.
Geospatial data
Information linked to a geographical location or area, such as flood risk along a river or population statistics within neighbourhood boundaries.
Layer
A set of geographical information displayed in a GIS, such as roads, flood-risk zones or important buildings, which can be viewed alongside other sets of information.
Base map
The background map beneath GIS data layers, providing reference features such as streets, place names or satellite imagery.
Distribution
The way something is spread across an area.
Spatial pattern
An arrangement of geographical features or values, such as a cluster, a line or a change from one part of an area to another.
Choropleth map
A map that uses different colours or shades to show data values for defined areas.
Dot density map
A map in which each dot represents a stated number of people, households or other items within an area, rather than necessarily marking their exact locations.
Put your knowledge into practice — try past paper questions for Geography B
Geographic information system (GIS)
A computer system that captures, stores, analyses and displays data linked to geographical locations.
Geospatial data
Information linked to a geographical location or area, such as flood risk along a river or population statistics within neighbourhood boundaries.
Layer
A set of geographical information displayed in a GIS, such as roads, flood-risk zones or important buildings, which can be viewed alongside other sets of information.
Base map
The background map beneath GIS data layers, providing reference features such as streets, place names or satellite imagery.
Distribution
The way something is spread across an area.
Spatial pattern
An arrangement of geographical features or values, such as a cluster, a line or a change from one part of an area to another.
Choropleth map
A map that uses different colours or shades to show data values for defined areas.
Dot density map
A map in which each dot represents a stated number of people, households or other items within an area, rather than necessarily marking their exact locations.