

Loading…
Loading…
Loading…
Eduqas GCSE Geography B · C112
Eduqas C112 · 4.1 Graph Construction and Selection Check the specification (PDF) (opens in a new tab)
Select and construct appropriate charts and graphs using accurate scales to present geographical data.
Create bar charts, line charts, climate graphs, and hydrographs to represent temporal and continuous data.
Construct pie charts, pictograms, and proportional circles to display categorical data proportions.
Develop histograms with equal class intervals, dispersion graphs, and scatter graphs to analyze distributions.
Construct specialized geographical graphics including star graphs, radial graphs, kite diagrams, and triangular graphs.
A useful graph makes a pattern easier to see than a list of figures. The choice depends on what the values represent and what you want to compare.
Use a bar chart to compare separate categories or amounts recorded during distinct periods. For example, bars can compare monthly precipitation totals or river-channel measurements at separate sampling sites. Their heights show the amounts; equal gaps keep the separate months or categories clear.
Use a line chart to show how a variable changes along a continuous scale, such as time or distance. Joining the points makes increases, decreases and turning points easier to follow. Mean monthly temperature is commonly shown this way. A line chart can also show how river velocity changes with distance downstream. Do not join unrelated categories such as different types of land use: a connecting line would suggest a continuous sequence that those categories do not have.
Start by identifying the variable for each axis. For a time-series graph, time normally goes along the horizontal axis and the measured quantity goes up the vertical axis. Include a clear title, axis labels and units.
Check the smallest and largest values before choosing a scale. Suppose the largest precipitation total is 110 mm. A vertical scale from 0 to 120 mm, marked every 20 mm, would fit all the bars. If each 20 mm interval occupies two small squares, each small square represents 10 mm. A value of 30 mm therefore reaches three small squares above zero.
The numerical steps must remain equal along an axis. For a bar chart, start the value axis at zero because the bar's length represents the amount. Starting above zero would distort comparisons between bars. For a line chart, choose a clearly labelled range that shows the variation; the value axis need not always begin at zero.
For a bar chart, mark the categories or periods along the horizontal axis. Draw bars of equal width with consistent gaps, using a ruler. Each bar should reach the correct value on the vertical scale.
For a line chart, locate each point using both axes. If readings were taken at 0, 2 and 6 hours, the last horizontal interval must be twice as wide as the first: the spacing represents elapsed time. Join the points in chronological order. The same principle applies to a distance axis: sampling sites must be positioned according to their distances, not simply spaced equally. A point between labelled scale marks should be positioned proportionately, not rounded to the nearest mark.
Once plotting is complete, check the graph against the data, especially its highest and lowest values. Add a key whenever more than one variable or series is shown.
A climate graph brings together two aspects of a place's climate: monthly precipitation totals and mean monthly temperatures. Put January to December in order along the horizontal axis. Use a precipitation scale in millimetres and a separate temperature scale in degrees Celsius. Plot precipitation as bars and temperature as small points centred on each month, joined by a line.
Consider the following practice data for a fictional place. The precipitation figures are monthly totals; the temperatures are monthly means.
| Month | Precipitation (mm) | Temperature (°C) |
|---|---|---|
| Jan | 90 | 5 |
| Feb | 70 | 6 |
| Mar | 60 | 8 |
| Apr | 50 | 11 |
| May | 50 | 14 |
| Jun | 40 | 17 |
| Jul | 30 | 19 |
| Aug | 40 | 18 |
| Sep | 60 | 15 |
| Oct | 80 | 11 |
| Nov | 100 | 8 |
| Dec | 110 | 6 |
A precipitation scale of 0–120 mm in 20 mm steps and a temperature scale of 0–20 °C in 5 °C steps accommodate these values. For January, draw a bar to 90 mm on the precipitation scale and place the temperature point at 5 °C on the temperature scale.
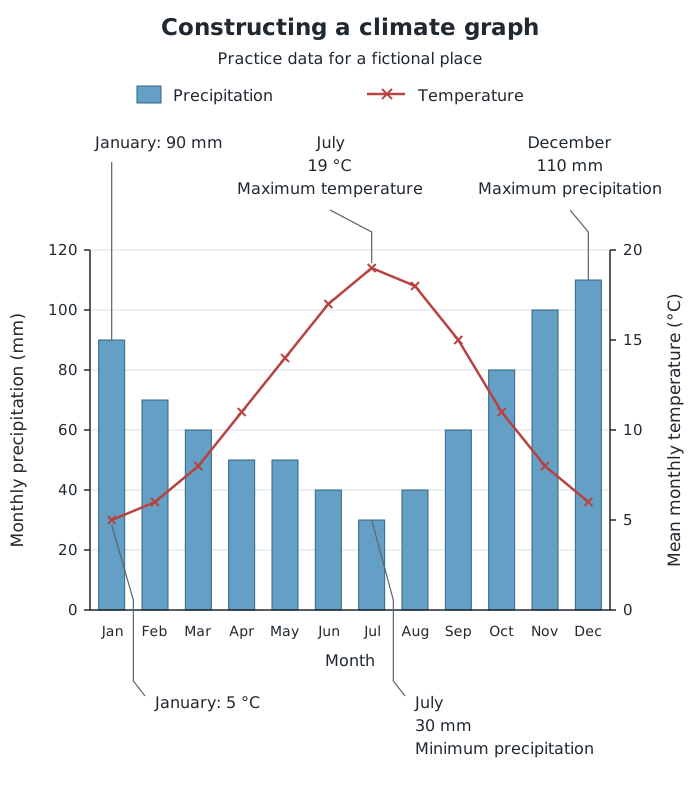
Practice climate graph for a fictional place. Read the bars from the precipitation axis and the line from the temperature axis.
The completed graph shows a warmer, drier summer and a cooler, wetter winter. July is the warmest month at 19 °C and has the lowest precipitation total, 30 mm. December is the wettest month, with 110 mm. The annual temperature range is the warmest monthly mean minus the coldest: .
When transferring this method to real climate data, use the supplied values rather than assuming that every place has this seasonal pattern. Climate graphs summarise monthly conditions; they do not show every day's weather.
A hydrograph shows changing river discharge: the volume of water passing a point in the river each second. Plot time on the horizontal axis and discharge, usually in , on the vertical axis. Plot each discharge reading and join the points in time order.
Suppose discharge readings at 0, 2, 4, 6 and 8 hours are respectively 4, 6, 12, 8 and 5 . Use equal two-hour intervals horizontally and, for example, a discharge scale from 0 to 14 in steps of 2. The line rises to a peak of 12 at four hours, then falls.
A storm hydrograph can also display rainfall as bars against a separate rainfall axis in millimetres. Both series share the same time axis, allowing you to compare when rain falls with when the river responds. Keep rainfall and discharge scales distinct, just as precipitation and temperature use separate scales on a climate graph. Read the time and value of the highest discharge from the line, rather than confusing the tallest rainfall bar with the river's peak flow.
Label both axes with the variable and its unit, and use equal numerical steps along each scale.
Choose scales that fit the largest values and use most of the available plotting space. Start a bar chart's value axis at zero.
Keep bar widths and gaps consistent. Plot line-graph points at their correct horizontal positions, rather than spacing every observation equally regardless of time or distance.
On a climate graph, read precipitation from its own axis and temperature from its own axis: their plotted heights are not directly comparable.
Support descriptions with values and named months or times, rather than simply saying that a graph rises or falls.
It can see this note and what your specification asks for.
Answers are free with an account.
1 free note left this week
Get more free notesYour answer sets when this note comes back for review, or marks it complete.
Was this note helpful?
Log in to tell us whether it helped, or to report a problem.
Last updated
Bar chart
A graph that uses the heights or lengths of separate bars to compare values for categories or distinct time periods.
Line chart
A graph in which plotted points are joined in order to show how a variable changes along a continuous scale, such as time or distance.
Climate graph
A combined graph showing monthly precipitation as bars and mean monthly temperature as a line.
Hydrograph
A graph showing how river discharge changes over time.
River discharge
The volume of water passing a point in a river each second, usually measured in cubic metres per second, .
Graph scale
The relationship between distances along a graph axis and the values they represent.
Annual temperature range
The difference between the highest and lowest mean monthly temperatures.
Put your knowledge into practice — try past paper questions for Geography B
Bar chart
A graph that uses the heights or lengths of separate bars to compare values for categories or distinct time periods.
Line chart
A graph in which plotted points are joined in order to show how a variable changes along a continuous scale, such as time or distance.
Climate graph
A combined graph showing monthly precipitation as bars and mean monthly temperature as a line.
Hydrograph
A graph showing how river discharge changes over time.
River discharge
The volume of water passing a point in a river each second, usually measured in cubic metres per second, .
Graph scale
The relationship between distances along a graph axis and the values they represent.
Annual temperature range
The difference between the highest and lowest mean monthly temperatures.
For climate graphs, identify the warmest, coldest, wettest and driest months and the seasonal pattern.
For hydrographs, identify peak discharge and when it occurs. Discharge is normally measured in ; rainfall is measured in mm.