

Loading…
Loading…
Loading…
Eduqas GCSE Geography B · C112
Eduqas C112 · 2.2.1 Development of River Landscapes Check the specification (PDF) (opens in a new tab)
Rain falling on a UK river landscape does not all reach the river immediately. Some is held on leaves, some soaks into the ground, and some flows quickly across the surface. These different routes help explain why rivers respond differently to rainfall.
A drainage basin is the area of land drained by a river and its tributaries. It is an open system: water enters and leaves it. Precipitation, including rain and snow, is the main input. Water leaves through evaporation, transpiration and river flow out of the basin.
Within the basin, a store holds water temporarily, while a flow, or transfer, moves water between places. Water can be stored on vegetation, in puddles and lakes, in soil, in rock underground and in the river channel. The routes between these stores determine how much water reaches the river and how quickly it arrives.
Interception occurs when vegetation catches precipitation on leaves and branches. This water may evaporate back into the atmosphere or later reach the ground. Interception therefore delays some rainfall and prevents some of it from reaching the river at all.
Infiltration is water soaking from the surface into the soil. It adds to the soil-water store. Water can then move sideways through the soil towards a river: this is throughflow. Alternatively, it can move downwards into underlying rock, a process called percolation. Water stored in permeable rock moves slowly towards the river as groundwater flow, helping maintain river flow between storms.
Surface run-off is water flowing over the ground towards the river. It occurs where water cannot soak in, or where rain arrives faster than the ground can absorb it. Saturated soil already has its available spaces filled with water, so further rainfall is more likely to run off. Surface run-off usually delivers water more rapidly than throughflow or groundwater flow.
Plants also take up soil water through their roots. Transpiration releases this water into the atmosphere as water vapour, mainly through leaves. Together, evaporation and transpiration reduce the water available to reach the river.
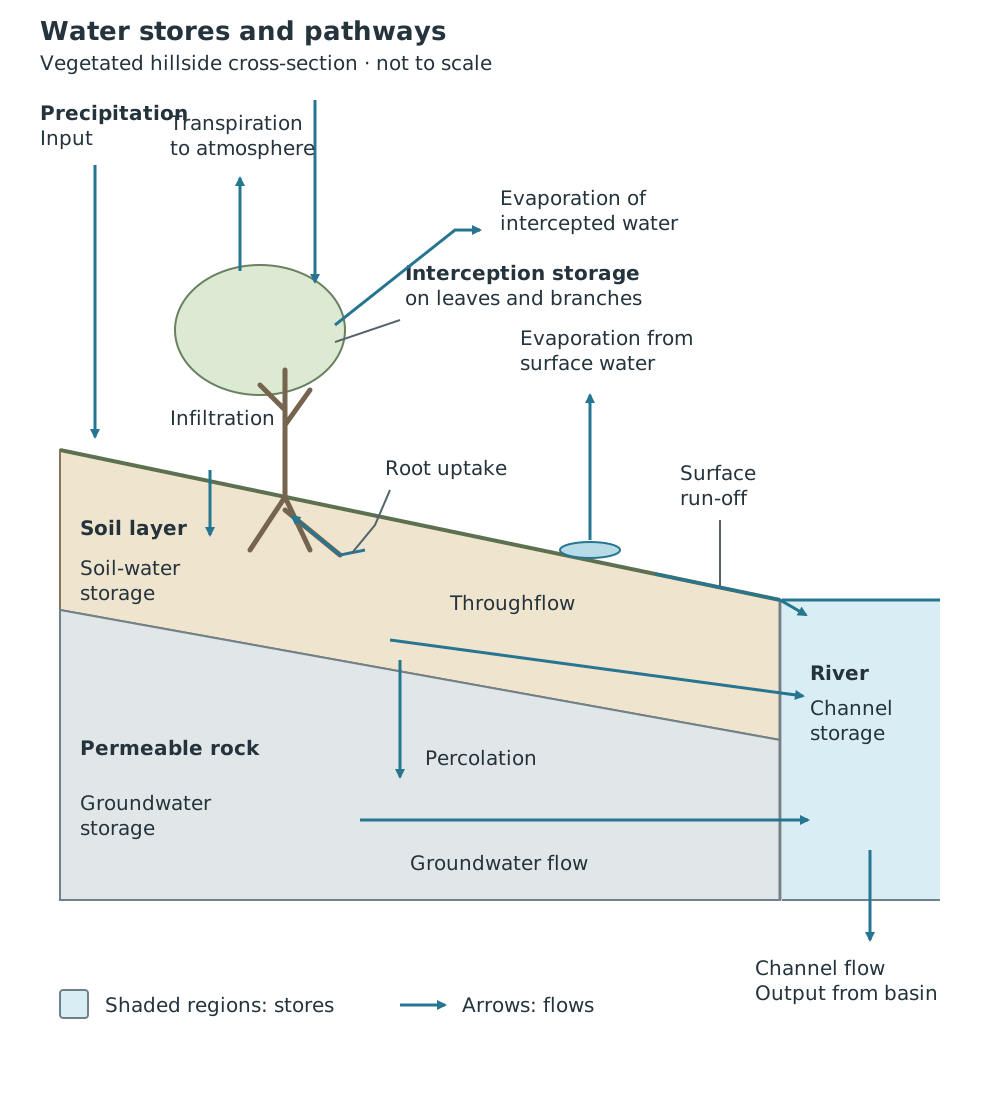
Water can reach a river rapidly over the surface or more slowly through soil and rock; some returns to the atmosphere.
The important connection is between route and timing. Water held in stores or travelling underground is delayed; water travelling over the surface can reach the channel quickly.
Permeable rock allows water to pass through it. Where soil and underlying rock allow water to enter, more rainfall can move into underground stores. This generally reduces immediate surface run-off and gives a slower river response. Groundwater released gradually can continue supplying the river during dry periods.
Impermeable rock does not readily allow water through. Less water can move down into it, so more may remain near the surface and reach the river as run-off. The soil above the rock also matters: water may initially infiltrate the soil even if the underlying rock is impermeable.
Geology therefore affects both storage and the speed of transfer. Two basins receiving similar rainfall can have different river responses because water takes different routes through them.
Removing trees reduces interception, so more rainfall reaches the ground directly. It also reduces transpiration. Tree roots help water enter the soil; losing vegetation can reduce infiltration and increase surface run-off. More water may consequently reach the river quickly during a storm.
Planting trees can have the opposite effects: greater interception and infiltration, with more water delayed in stores and less rapid run-off. Human changes are therefore not always harmful; their effects depend on what is changed.
Urbanisation replaces vegetation and soil with buildings, concrete and tarmac. These impermeable surfaces reduce infiltration and underground recharge while increasing surface run-off. With less interception and more rapid transfer to the channel, discharge can rise faster after rainfall. Compared with an otherwise similar vegetated basin, an urban basin often has a shorter lag time and a higher peak discharge.
These changes affect both flows and stores: urbanisation does not simply add water to the system, but changes where rainfall goes and how quickly it arrives.
River discharge is the volume of water passing a particular point each second, usually measured in cubic metres per second, . It changes as the supply of water to the channel changes.
The UK has a temperate climate, but rainfall and temperature vary geographically. The north and west generally receive more rainfall than the south and east. Other things being equal, greater precipitation provides more water for river discharge. Higher temperatures increase evaporation and transpiration, leaving less water available for river flow.
An annual regime shows the pattern of discharge through the year, often using mean monthly discharge. Many UK rivers have higher discharge in winter, when evaporation and transpiration are lower and wet ground encourages run-off. Summer discharge is often lower because warmer conditions and active vegetation increase water losses to the atmosphere.
This is not an identical pattern for every river. In colder upland areas, precipitation stored as snow may delay the river response until a spring thaw. Geology and land use also modify the seasonal pattern.
To interpret an annual regime graph, identify the highest and lowest discharge months, then explain the pattern using seasonal precipitation, temperature and water losses. It describes seasonal variation, not the response to a single storm.
A storm hydrograph shows discharge during and after a rainfall event. Time runs along the horizontal axis. Rainfall is often shown as bars, while discharge is shown as a line using a separate vertical scale.
The rising limb is the section where discharge increases as storm water reaches the river. A steep rising limb indicates a rapid increase. Peak discharge is the highest discharge reached. The recession limb shows discharge falling as the storm's contribution declines. Slow drainage from soil and groundwater can continue after rainfall has stopped.
Lag time is the interval between peak rainfall and peak discharge. It exists because water takes time to travel through the drainage basin. A short lag time suggests rapid transfer, often with a large contribution from surface run-off.
Suppose observations begin at hour 0. In this example, rainfall peaks at hour 4 at 12 mm per hour, but discharge peaks at hour 7 at 30 . The lag time is hours. Discharge rises from a pre-storm flow of 5 and then falls gradually as stored water continues to drain into the channel.
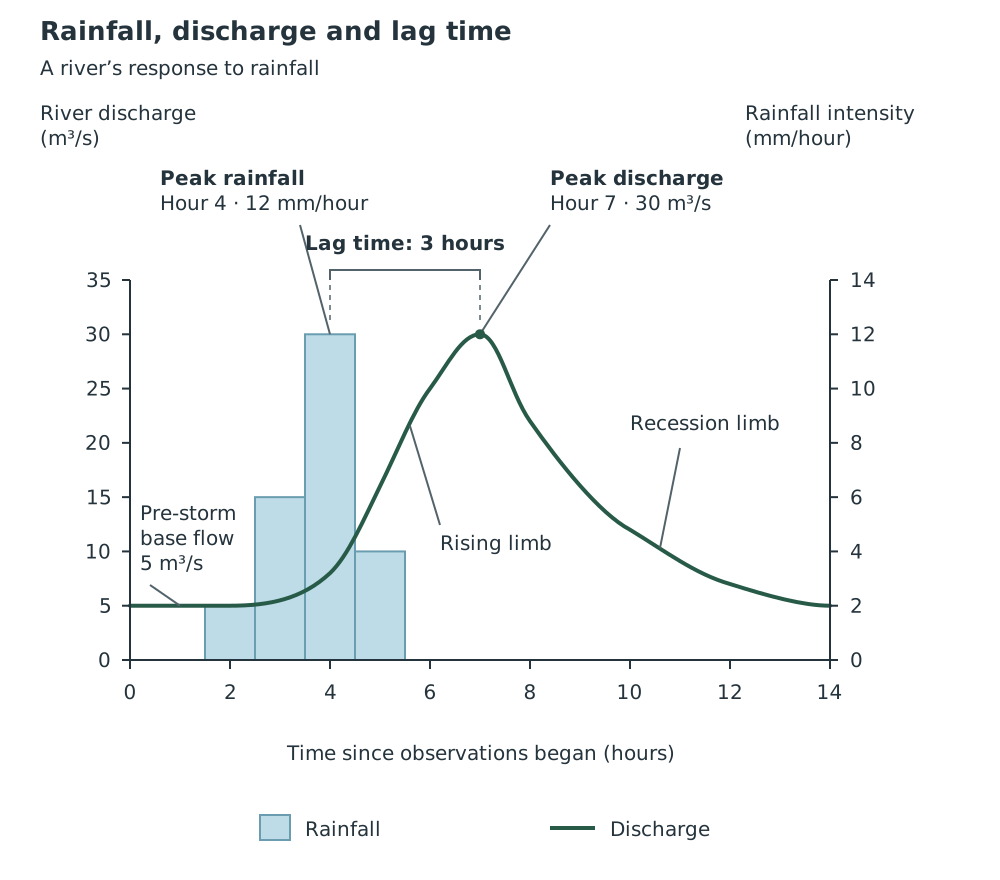
Rainfall peaks before discharge because water takes time to reach the river.
The delayed peak shows that rainfall and discharge are connected, but their highest values do not occur simultaneously. Intense or prolonged rainfall, especially on saturated ground, can produce more surface run-off and a rapid rise in discharge. However, rainfall alone does not determine the hydrograph: geology, vegetation and urbanisation influence its shape too.
Build explanations as a chain: impermeable surfaces → less infiltration → more rapid surface run-off → a shorter lag time and higher peak discharge.
Read both axes and their units on a storm hydrograph. Rainfall and discharge usually use different scales.
Calculate lag time from peak rainfall to peak discharge, not from the start of rainfall. For rainfall bars, use the centre of the highest bar.
Support graph descriptions with values and times. A higher peak increases flood risk, but flooding occurs only if the river exceeds its channel capacity.
Distinguish an annual regime from a storm hydrograph: one shows the seasonal pattern across a year; the other shows the response to a particular storm.
It can see this note and what your specification asks for.
Answers are free with an account.
1 free note left this week
Get more free notesYour answer sets when this note comes back for review, or marks it complete.
Was this note helpful?
Log in to tell us whether it helped, or to report a problem.
Last updated
Drainage basin
The area of land drained by a river and its tributaries, also called its catchment.
Water store
A place where water is held temporarily, such as vegetation, soil, rock or a river channel.
Interception
The capture and temporary storage of precipitation by vegetation, especially leaves and branches.
Transpiration
The release of water vapour into the atmosphere from plants, mainly through their leaves, after water has been taken up by roots.
Infiltration
The movement of water from the ground surface into the soil.
Surface run-off
The movement of water over the land surface towards a river.
Throughflow
The sideways movement of water through soil towards a river.
River discharge
The volume of water passing a particular point in a river each second, usually measured in .
Annual regime
The pattern of variation in a river's discharge over a year, commonly shown using mean monthly discharge.
Storm hydrograph
A graph showing how river discharge changes during and after a rainfall event, often with rainfall shown alongside it.
Lag time
The time between peak rainfall and peak river discharge during a storm.
Base flow
The contribution to river discharge supplied mainly by slow groundwater flow, which helps maintain flow between storms.
Put your knowledge into practice — try past paper questions for Geography B
Drainage basin
The area of land drained by a river and its tributaries, also called its catchment.
Water store
A place where water is held temporarily, such as vegetation, soil, rock or a river channel.
Interception
The capture and temporary storage of precipitation by vegetation, especially leaves and branches.
Transpiration
The release of water vapour into the atmosphere from plants, mainly through their leaves, after water has been taken up by roots.
Infiltration
The movement of water from the ground surface into the soil.
Surface run-off
The movement of water over the land surface towards a river.
Throughflow
The sideways movement of water through soil towards a river.
River discharge
The volume of water passing a particular point in a river each second, usually measured in .
Annual regime
The pattern of variation in a river's discharge over a year, commonly shown using mean monthly discharge.
Storm hydrograph
A graph showing how river discharge changes during and after a rainfall event, often with rainfall shown alongside it.
Lag time
The time between peak rainfall and peak river discharge during a storm.
Base flow
The contribution to river discharge supplied mainly by slow groundwater flow, which helps maintain flow between storms.
Discharge is measured in . An annual regime shows its seasonal pattern across a year.
A steep rising limb and short lag indicate rapid transfer to the river. A high peak increases flood risk if channel capacity is exceeded.