

Loading…
Loading…
Loading…
Eduqas GCSE Geography A · C111
Eduqas C111 · Numerical Skills Check the specification (PDF) (opens in a new tab)
Fieldwork gathers evidence to answer a geographical question. A useful question identifies what you want to investigate and where. For example, at the Stiperstones ridge in the Shropshire Hills, visitors repeatedly walking along the same routes have damaged vegetation and contributed to soil erosion. An enquiry could ask: How does vegetation cover change across a trampled footpath?
This question needs numerical measurements of vegetation cover, but descriptions and sketches can help explain the pattern. Quantitative data consists of numbers obtained by counting or measuring. Qualitative data records non-numerical information, such as descriptions, sketches and opinions. Using both can connect a measured pattern with conditions observed on the ground.
Plan the procedure before visiting: decide what to record, where to sample, which equipment to use and how observations will be repeated. Check permission and safe access. Unsafe locations must be excluded, even if this limits the area your conclusions can represent.
A data collection sheet should contain the information needed to answer the question, with clear headings and units. Record the location, date, time, observer and relevant conditions so that the results can be understood and the method repeated.
For a vegetation enquiry, a suitable layout is:
| Quadrat ID | Control or transect | Distance along transect (m) | Bilberry cover (%) | Heather cover (%) | Other plants (%) | Bare soil/rock (%) | Notes |
|---|
Use one row for each quadrat. The notes column can record uneven ground, difficulty identifying plants or other conditions that might affect interpretation. Decide in advance how overlapping vegetation will be recorded, and use that rule consistently. Keep a missing observation distinct from a genuine zero: zero means you looked and found none.
If collecting visitor counts instead, the sheet would need the site, start and finish times, count duration and number of visitors. Equal counting periods allow fair comparisons between sites. For an environmental impact survey, print the scoring rules on the sheet so that different observers interpret the scale in the same way.
Accuracy means closeness to the true value. Read equipment carefully, check its condition and record the correct units. Estimating plant cover is less precise than directly counting objects, so a grid and an agreed estimation method help observers make comparable judgements.
Reliability concerns consistency when the procedure is repeated under comparable conditions. Use the same equipment size, timing and recording rules throughout. Repeated observations help reveal whether one result is unusual; observers can also compare their estimates in the same quadrat before beginning the survey.
Sample size is the number of measurements or respondents. One quadrat could happen to land on an unusually bare patch. Several quadrats give a better picture of variation. However, a large sample is not automatically representative: hundreds of visitor responses collected only beside one car park might miss people entering elsewhere.
Choose a sample size that gives useful coverage within the available time. Record both the number of observations and how they were selected, because the selection procedure affects how widely the findings can be applied.
A sample allows you to investigate without recording everything. The aim is a representative sample: one that fairly reflects the whole population or area relevant to the enquiry.
Random sampling gives every eligible sample point an equal chance of selection. To compare pedestrian activity in a country park, list all eligible count locations and draw names from a bag without looking. This avoids choosing only the busiest-looking places. However, selected sites may cluster together, leaving some parts of the park poorly covered.
Systematic sampling uses regular intervals in distance or time. At the Stiperstones, environmental impact scores were collected every 100 m from a car park. This provides an orderly spread of observations suitable for investigating change with distance. Its limitation is that important variation between the sampling points may be missed.
Stratified sampling divides the population or area into groups, called strata, and samples them in proportion to their size. For a visitor questionnaire, age groups could be the strata. If a group forms 20% of the relevant population, it should form 20% of the sample. This helps include different groups fairly, but requires information about their sizes before sampling begins. Selection within each group should also avoid favouring particular people.
Opportunistic sampling uses people or sites that are conveniently or safely available. River sites may be chosen because access is permitted and safe. This can make fieldwork feasible, but accessible sites may differ from inaccessible ones. Explain that limitation rather than assuming the findings represent the whole river.
A quadrat is a frame enclosing a known area; the Stiperstones method describes a metal or plastic grid usually about half a metre across. Place it on the ground and estimate the percentage occupied by each plant category and by bare soil or rock. Each equal-sized grid square represents an equal fraction of the quadrat, helping you estimate cover more consistently. Use the same frame and estimation rules at every location.
A control provides a comparison with an area apparently unaffected by the factor being investigated. For trampling, take at least five control quadrat measurements in different places away from the path. Choose areas otherwise as comparable as possible, so that differences are less likely to result simply from different growing conditions. Calculate the mean percentage cover of each plant category in the controls to provide a comparison with the transect results.
Next, lay a transect across the footpath, beginning and ending several metres beyond the eroded section. Sample with quadrats every 2 m along it. This captures the path and its vegetated edges, where people may walk to avoid uneven stones.
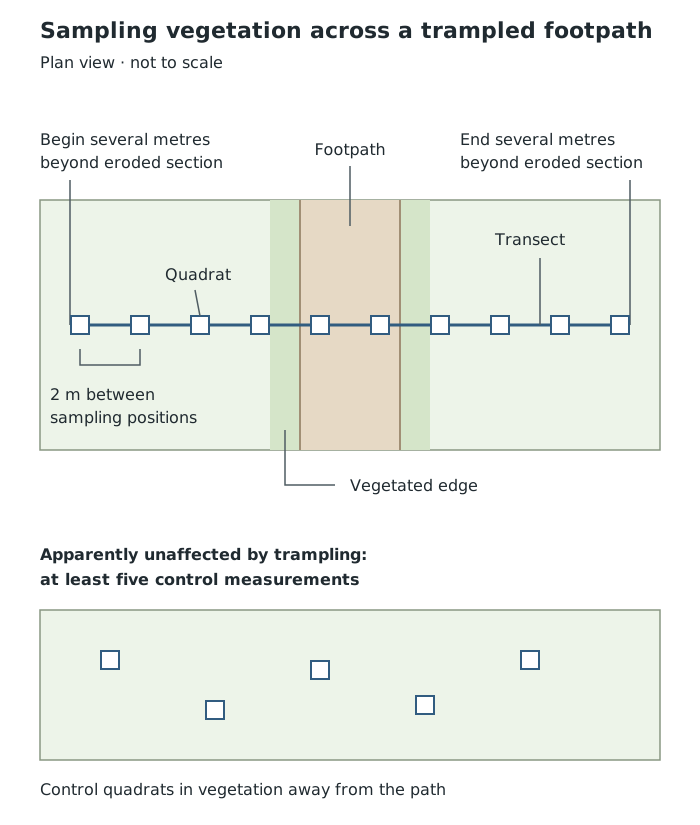
Compare quadrats across the path with control quadrats away from trampling. Layout shown is a method diagram, not a measured site map.
Record each quadrat's position and percentage cover. Complete the planned measurements, check that every required row is filled in or marked as missing, and remove all equipment. Wear suitable footwear, avoid unstable rocks, keep the tape from becoming a trip hazard and avoid damaging plants unnecessarily.
The Stiperstones control quadrats recorded no bare soil or rock. Along the transect, quadrats 4 and 6 recorded 100% bare soil or rock. This comparison is consistent with vegetation loss in heavily trampled areas. It does not, by itself, prove that trampling explains every difference: natural variation and differences between control and transect locations must also be considered.
A sketch map shows a place from above. It simplifies the layout to make geographical relationships clear, rather than copying every detail of a map or photograph. Select the features relevant to the enquiry: for a visitor survey, these might be entrances, paths and sampling sites.
Draw a frame, then lightly divide it into sections to help place features accurately. When working from an OS map, its gridlines can guide placement; when working from a photograph, dividing it into four sections can help you transfer relative positions. Keep the proportions consistent if you enlarge or reduce the drawing. Include a title, orientation and a key where symbols or shading are used. Add annotations that explain relevant details, rather than only naming features.
Suppose an enquiry takes place in a small park with an entrance on its southern edge, a pond to the east and a path running north from the entrance. Place the entrance at the bottom of a north-up frame, draw the path towards the top and put the pond to its right. Mark numbered visitor-count sites along the path, matching the numbers on the data sheet. A simple key can distinguish the path, pond and survey sites. An annotation such as 'Site 1: beside the main entrance' connects the survey with its setting.
Interpret the map by comparing positions: are high recorded counts concentrated near the entrance, or spread along the route? The map can show a spatial relationship, but visitor numbers must come from recorded counts, not from how prominent a feature looks in the drawing. On a real visit, check the layout and orientation against what is actually present. A sketch based only on estimated positions is not suitable for exact distance measurements; add a scale only when it is supported by measurements or the original map.
A field sketch shows the landscape from your viewpoint, rather than from above. Record the location or site number, viewpoint, direction of view, date and a descriptive title. Choose a safe place to stand. Draw a frame and the main outlines first, then add the features relevant to the enquiry. Detailed artistic shading is less useful than clear geographical annotations.
For example, suppose a path in front of you has exposed stones in its centre, a strip of bare ground beside it and vegetation further away. First outline the path as it recedes into the distance. Then mark the stones, bare strip and vegetation boundary. Use clear leader lines to attach annotations to the correct features, such as 'exposed stones in the path' and 'bare ground between the path and vegetation'. Leave out unrelated details that would obscure these contrasts.
Distinguish observation from explanation: 'bare ground beside the path' records what is visible; 'possibly widened by walkers avoiding stones' offers an interpretation that needs supporting evidence. Link annotations to nearby quadrat or site numbers so that the sketch can be read alongside the measurements.
To interpret this sketch, compare the centre of the path, its edges and the ground further away. Bare ground concentrated beside a path suggests a relationship worth investigating. Compare it with quadrat results and observations of walkers before concluding that trampling caused it. A field sketch can record visible contrasts, but perspective distorts apparent size, important details may be missed and conditions beyond the viewpoint remain unknown. Use measurements, rather than the drawing alone, to establish exact percentage cover or distances.
Evaluation asks whether the method produced evidence suitable for answering the question. Consider accuracy, repeatability, sample size, coverage and the suitability of the control. Identify a particular weakness and a matching improvement: closer sampling intervals could reveal changes missed between quadrats; repeated surveys could show whether a pattern persists.
A sound conclusion states what the observations support and recognises their limits. Findings from one transect describe that sampled route more confidently than the whole landscape.
| Method | Selection | Main limitation |
|---|---|---|
| Random | Equal chance for each eligible point | Sites may cluster |
| Systematic | Regular distance or time intervals | Variation between points may be missed |
| Stratified | Proportional samples from groups | Group sizes must be known |
| Opportunistic | Convenient or safely accessible sites | May be unrepresentative |
Justify a sampling method by linking it to the enquiry: systematic sampling suits changes along a route; stratified sampling suits comparisons between groups.
Random selection reduces selection bias, but does not guarantee an evenly spread or fully representative sample.
Distinguish accuracy from reliability: consistently repeated measurements can still be inaccurate if equipment or procedures are faulty.
Give a specific improvement and explain its benefit, rather than writing only 'collect more data' or 'avoid human error'.
Annotate sketches with geographical evidence and explanations, not just labels naming features. Do not give a sketch an exact scale unless distances are supported by measurements or the original map.
It can see this note and what your specification asks for.
Answers are free with an account.
1 free note left this week
Get more free notesYour answer sets when this note comes back for review, or marks it complete.
Was this note helpful?
Log in to tell us whether it helped, or to report a problem.
Last updated
Quantitative data
Numerical information obtained by counting or measuring, such as visitor numbers or percentage vegetation cover.
Qualitative data
Non-numerical information, such as descriptions, field sketches or people's opinions.
Accuracy
How close a measurement is to the true value.
Reliability
The consistency of results when a procedure is repeated under comparable conditions.
Sample size
The number of observations, measurements or respondents included in an investigation.
Representative sample
A sample that fairly reflects the relevant characteristics of the whole population or study area.
Bias
A systematic tendency for selection or measurement to favour particular results or groups.
Random sampling
Selecting sample points or participants so that each has an equal chance of selection.
Systematic sampling
Collecting observations at regular intervals in distance or time.
Stratified sampling
Dividing a population or area into groups and sampling each in proportion to its size.
Opportunistic sampling
Selecting observations or participants because they are conveniently or safely available.
Control
A comparison group or area not exposed to the factor being investigated.
Quadrat
A frame enclosing a known area, used to sample features such as plant cover.
Transect
A line across a study area along which observations or measurements are taken.
Sketch map
A simplified plan-view drawing showing the locations and relationships of geographical features.
Field sketch
A simplified drawing of a landscape as seen from a particular viewpoint, recording selected geographical features.
Put your knowledge into practice — try past paper questions for Geography A
Quantitative data
Numerical information obtained by counting or measuring, such as visitor numbers or percentage vegetation cover.
Qualitative data
Non-numerical information, such as descriptions, field sketches or people's opinions.
Accuracy
How close a measurement is to the true value.
Reliability
The consistency of results when a procedure is repeated under comparable conditions.
Sample size
The number of observations, measurements or respondents included in an investigation.
Representative sample
A sample that fairly reflects the relevant characteristics of the whole population or study area.
Bias
A systematic tendency for selection or measurement to favour particular results or groups.
Random sampling
Selecting sample points or participants so that each has an equal chance of selection.
Systematic sampling
Collecting observations at regular intervals in distance or time.
Stratified sampling
Dividing a population or area into groups and sampling each in proportion to its size.
Opportunistic sampling
Selecting observations or participants because they are conveniently or safely available.
Control
A comparison group or area not exposed to the factor being investigated.
Quadrat
A frame enclosing a known area, used to sample features such as plant cover.
Transect
A line across a study area along which observations or measurements are taken.
Sketch map
A simplified plan-view drawing showing the locations and relationships of geographical features.
Field sketch
A simplified drawing of a landscape as seen from a particular viewpoint, recording selected geographical features.