

Loading…
Loading…
Loading…
Eduqas GCSE Geography A · C111
Eduqas C111 · Numerical Skills Check the specification (PDF) (opens in a new tab)
Geographical numbers describe quantities such as distance, area, river velocity and population. A number becomes useful when you know what it measures, its unit and the place or time it represents. A river velocity of means water travels 0.29 metres in one second; it is not a distance of 0.29 metres.
Units let us compare measurements consistently. There are 100 centimetres in one metre and 1,000 metres in one kilometre. To convert metres into kilometres, divide by 1,000; to convert kilometres into metres, multiply by 1,000. Thus 550 m is 0.55 km.
A map reduces ground distances so that a large area fits on a page. A scale line shows how much ground distance a length on that particular map represents.
Measure the scale line and the distance you want using the same ruler units. Divide your map distance by the scale-line length, then multiply by the ground distance labelled on the scale line:
Suppose a scale line labelled 0–1 km measures 4 cm, and the straight-line distance between two points measures 6 cm. The distance is . This is one and a half scale-line lengths.
For a winding route, follow its bends with a strip of paper or thread, then measure the total length and apply the scale. A straight line between its endpoints would underestimate the route distance.
A ratio scale expresses the same relationship using matching units. At , 1 cm on the map represents 25,000 cm on the ground, or 250 m. At a fixed scale, map distance and ground distance are directly proportional: doubling one doubles the other.
Area measures the surface inside a boundary. An irregular feature can be approximated by rectangles and triangles. Choose shapes that follow the boundary reasonably closely, calculate their areas and add them together. Avoid counting the same surface twice.
The perpendicular height meets the base at a right angle. It need not be a side of the triangle.
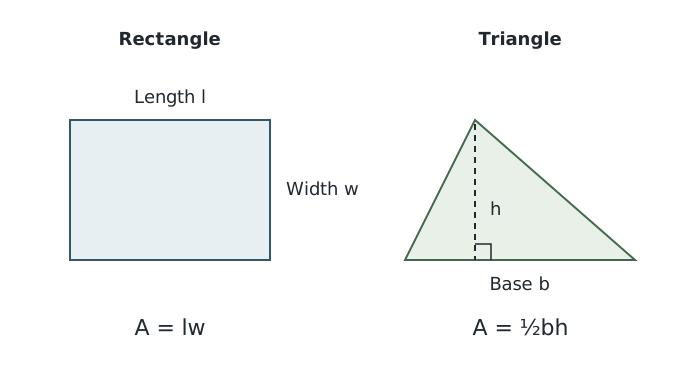
Estimate mapped areas with simple shapes; a triangle's height must be perpendicular to its base.
Convert the map measurements into ground lengths before using these formulae. For example, at , 1 cm represents 100 m. A rectangle measuring 5.5 cm by 3 cm therefore represents approximately 550 m by 300 m, giving .
This approach has been used to estimate the area of Redmires Reservoirs. Reservoirs A and C were approximated as rectangles and B as a triangle:
| Reservoir | Ground dimensions | Estimated area |
|---|---|---|
| A: rectangle | 550 m × 300 m | 165,000 m² |
| B: triangle | Base 550 m; perpendicular height 420 m | 115,500 m² |
| C: rectangle | 380 m × 240 m | 91,200 m² |
Adding the three estimates gives . This is an approximation because the simple shapes do not follow every bend in the shorelines. The same method transfers to other mapped features, but its accuracy depends on the measurements and how well the chosen shapes fit.
A square kilometre is a square 1,000 m long and 1,000 m wide. Therefore:
To convert m² into km², divide by 1,000,000. The Redmires estimate becomes . The conversion factor is larger than for length because both dimensions change.
A ratio compares quantities. A ratio of 21 children to 100 working-age people means 21 children for every 100 people in the comparison group. It does not mean that children form 21% of everyone in those two groups: their proportion would be , or approximately 17.4%.
A proportion expresses a part of a total. Always identify that total before turning a ratio into a fraction or percentage.
Youth-dependency figures of for Japan and for Nigeria illustrate the importance of matching denominators. Both compare children aged 0–14 with working-age people aged 15–64. Nigeria's figure is times Japan's. This compares the dependency ratios, not the actual numbers of children in the two countries.
Magnitude concerns how large a quantity is; frequency concerns how often something occurs. In the River Eea table below, for example, the May velocity of 0.21 m/s occurs at two of the six sampled sites. Its frequency is two. That count is different from the magnitude of the velocity itself.
Flood likelihood can be expressed as an annual chance. A 1-in-200 flood, sometimes written as a flood, has a 0.5% chance of happening in any one year. GOV.UK planning guidance uses this equivalence for tidal flooding. The fraction converts to a percentage as . This is an annual probability, not a timetable of one flood every 200 years.
Some geographical quantities span such a large range that an ordinary scale is inconvenient. A logarithmic scale represents equal multiplying factors with equal steps. For example, equally spaced marks on a base-ten logarithmic axis can represent 1, 10, 100 and 1,000. Each step multiplies the quantity by ten rather than adding the same amount.
The Richter scale is an example. Earthquake magnitude is estimated using the amplitude of ground motion recorded by a seismometer, with corrections for distance. Amplitude means the size of the vibration. A one-unit increase on the Richter scale corresponds to ten times the recorded seismic-wave amplitude.
For example, comparing magnitudes 5, 6 and 7:
| Comparison | Difference in magnitude | Amplitude multiplier |
|---|---|---|
| Magnitude 6 compared with 5 | 1 | |
| Magnitude 7 compared with 5 | 2 | |
| Magnitude 5 compared with 7 | −2 |
Magnitude 7 therefore represents a hundredfold amplitude compared with magnitude 5, not twice the amplitude. A factor of ten is one order of magnitude, so this hundredfold difference is two orders of magnitude. The key is to count the steps and multiply for each one.
Amplitude is not the same quantity as energy released. Each one-unit magnitude increase corresponds to about 30 times as much energy, rather than ten times. Modern scientists usually use moment magnitude for large earthquakes, but the Richter scale remains a useful example of how to interpret a logarithmic scale.
Start with a table's headings. Identify its variables, units, places and dates before looking for a relationship. The following measurements describe river velocity at six sites along the River Eea in Cumbria, at four points in the year.
| Distance from source (km) | December (m/s) | February (m/s) | May (m/s) | August (m/s) |
|---|---|---|---|---|
| 0.5 | 0.14 | 0.15 | 0.12 | 0.03 |
| 0.8 | 0.15 | 0.16 | 0.18 | 0.09 |
| 1.3 | 0.21 | 0.20 | 0.19 | 0.10 |
| 1.7 | 0.21 | 0.20 | 0.21 | 0.13 |
| 2.1 | 0.24 | 0.26 | 0.21 | 0.14 |
| 3.0 | 0.26 | 0.29 | 0.24 | 0.16 |
Reading down one month reveals a spatial pattern. In February, velocity generally increases with distance from the source, rising from 0.15 m/s at 0.5 km to 0.29 m/s at 3 km. The increase is 0.14 m/s. However, velocity remains at 0.20 m/s between the sites at 1.3 km and 1.7 km, so the increase is not continuous at every step.
Reading across one site reveals a temporal pattern. At 3 km, velocity is 0.26 m/s in December, 0.29 m/s in February, 0.24 m/s in May and 0.16 m/s in August. February has the highest recorded value at this site, while August has the lowest.
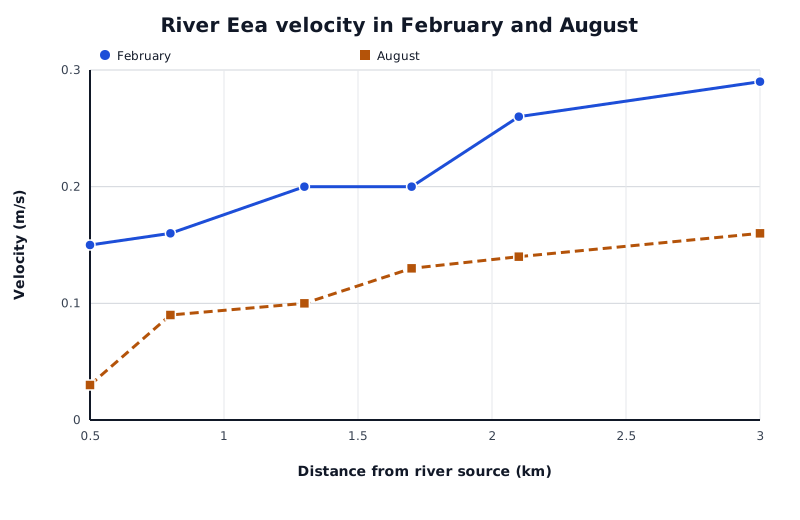
Recorded River Eea velocities at six sites: February values exceed August values at every sampled site.
Data for River Eea velocity in February and August
| Series | Distance from river source (km) | Velocity (m/s) |
|---|---|---|
| February | 0.5 | 0.15 |
| February | 0.8 | 0.16 |
| February | 1.3 | 0.2 |
| February | 1.7 | 0.2 |
| February | 2.1 | 0.26 |
| February | 3 | 0.29 |
| August | 0.5 | 0.03 |
| August | 0.8 | 0.09 |
| August | 1.3 | 0.1 |
| August | 1.7 | 0.13 |
| August | 2.1 | 0.14 |
| August | 3 | 0.16 |
The graph plots two columns from the table. Read the horizontal axis to locate a site, then compare the heights of the two lines there. August velocity is lower than February velocity at every sampled site. The gap is 0.12 m/s at 0.5 km and 0.13 m/s at 3 km.
A sound conclusion combines a pattern, numerical evidence and an appropriate limit. These measurements support the conclusion that velocity generally increases downstream and is lower in August than February at the sampled sites. They do not, by themselves, establish the cause or show that the same pattern occurs in every year.
Use the scale line on the displayed map: a stated ratio scale may no longer be accurate if the map has been resized.
Convert lengths into the same ground unit before calculating area, and give area in squared units.
For a triangle, use the perpendicular height, not the length of a sloping side.
Support a pattern with figures and units, then identify any exceptions. An overall increase does not mean every value increases.
Check the denominator before comparing proportions: a ratio to working-age people is not a percentage of the whole population.
A numerical pattern alone does not prove its cause.
On the Richter scale, a two-unit difference means 100 times the seismic-wave amplitude, not twice the amplitude.
A 1-in-200 flood has a 0.5% chance of happening in any one year; it is not a flood scheduled every 200 years.
It can see this note and what your specification asks for.
Answers are free with an account.
1 free note left this week
Get more free notesYour answer sets when this note comes back for review, or marks it complete.
Was this note helpful?
Log in to tell us whether it helped, or to report a problem.
Last updated
Area
The amount of surface covered by a shape or geographical feature, measured in square units such as m² or km².
Map scale
The relationship between a distance on a map and the corresponding distance on the ground.
Scale line
A labelled bar on a map showing the ground distance represented by a particular map length.
Ratio
A comparison of quantities by division, written, for example, as .
Proportion
The share of a total belonging to a particular group or category, expressed as a fraction, decimal or percentage.
Direct proportion
A relationship in which two quantities change by the same multiplying factor, so their ratio remains constant.
Magnitude
The size of a quantity or event.
Frequency
The number of times an event or value occurs within a stated period or dataset.
Logarithmic scale
A scale on which equal steps represent multiplication by a fixed factor rather than addition of a fixed amount.
Order of magnitude
A factor of ten in size: a hundredfold difference is two orders of magnitude.
Richter scale
An earthquake magnitude scale on which each one-unit increase represents a tenfold increase in recorded seismic-wave amplitude, allowing for distance.
Amplitude
The maximum size of a vibration or wave movement from its resting position.
Spatial pattern
A relationship or distribution across different places.
Temporal pattern
A relationship or change through time.
Put your knowledge into practice — try past paper questions for Geography A
Area
The amount of surface covered by a shape or geographical feature, measured in square units such as m² or km².
Map scale
The relationship between a distance on a map and the corresponding distance on the ground.
Scale line
A labelled bar on a map showing the ground distance represented by a particular map length.
Ratio
A comparison of quantities by division, written, for example, as .
Proportion
The share of a total belonging to a particular group or category, expressed as a fraction, decimal or percentage.
Direct proportion
A relationship in which two quantities change by the same multiplying factor, so their ratio remains constant.
Magnitude
The size of a quantity or event.
Frequency
The number of times an event or value occurs within a stated period or dataset.
Logarithmic scale
A scale on which equal steps represent multiplication by a fixed factor rather than addition of a fixed amount.
Order of magnitude
A factor of ten in size: a hundredfold difference is two orders of magnitude.
Richter scale
An earthquake magnitude scale on which each one-unit increase represents a tenfold increase in recorded seismic-wave amplitude, allowing for distance.
Amplitude
The maximum size of a vibration or wave movement from its resting position.
Spatial pattern
A relationship or distribution across different places.
Temporal pattern
A relationship or change through time.