Loading…


Loading…
Loading…
Loading…
Edexcel GCSE Combined Science · 1SC0
Edexcel 1SC0 · Cell Division and Growth Check the specification (PDF) (opens in a new tab)
Growth is a permanent increase in size or mass. A developing organism needs more cells, but it also needs different kinds of cell to perform different jobs. Growth and development therefore involve both increasing cell number and producing specialised cells.
In animals, cell division increases the number of cells. Division involving mitosis produces genetically identical body cells, allowing tissues to grow. Cell differentiation then produces cells with structures suited to particular functions. These processes allow a developing animal to become larger while also forming tissues that carry out different jobs.
Plants grow through cell division, cell elongation and differentiation. Division adds cells; elongation makes cells longer, increasing the length of growing parts; differentiation gives cells the specialised features needed for their functions. These are distinct contributions: adding cells, lengthening cells and adapting cells for particular jobs.
A multicellular organism is made of many cells that work together. If every cell remained unspecialised, the organism could not carry out all the different functions it needs. Differentiation enables cells to become suited to specific roles.
For example, as a cell develops into a nerve cell, its cell membrane and cytoplasm extend to form long connections. This structure enables communication over long distances within the body. The important link is between structure and function: differentiation develops a structure that helps the cell do its job.
Most cells in an organism contain the same genetic information, but different cell types have different genes active. During differentiation, this difference in gene activity leads to the development of different cell structures. A specialised cell usually does not need a different set of genes; it uses different parts of the shared genetic information.
In animals, most differentiation happens early in development. Once mature, most specialised animal cells cannot change into other cell types. Cell division in mature animals is mainly used for repair and replacement, although some cells retain the ability to differentiate and supply replacement cells.
Plants differ because many plant cells retain the ability to differentiate throughout the plant's life. This helps plants continue developing new specialised cells as they grow.
Growth can be monitored by taking measurements repeatedly and comparing them with a reference population. For babies, measurements include mass, length and head circumference. Growth charts compare these measurements with those of other children of the same age. Boys and girls use different charts because their usual growth patterns differ.
A percentile line shows a position within the comparison group. A child on the 25th percentile for mass is heavier than approximately 25% and lighter than approximately 75% of children of the same age in that group. The 50th percentile is the median: approximately half the group has a lower mass and half has a higher mass.
A percentile is therefore a comparison, not a target that every child should reach. Healthy children can have different masses and follow different percentile lines.
On a mass-for-age chart, age is on the horizontal axis and mass is on the vertical axis. To find a child's percentile:
The following chart is a constructed teaching illustration, not a clinical growth chart.
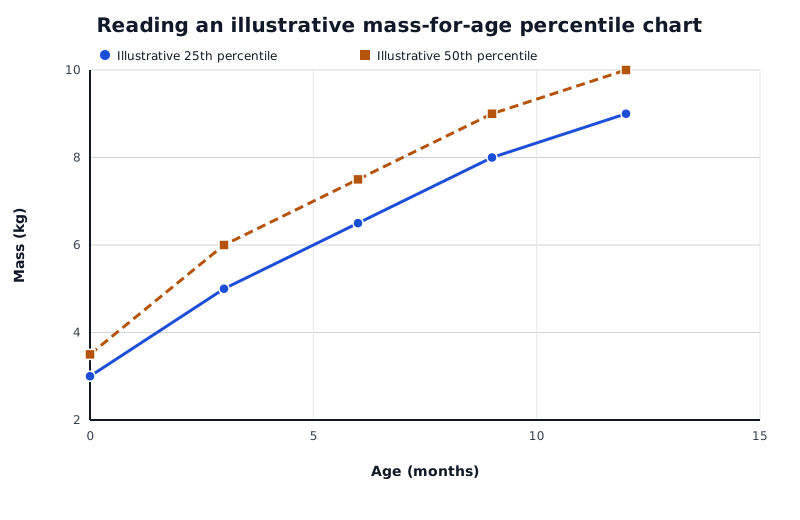
Values showing how percentile lines are read. This is not a clinical growth chart or measured population data.
Data for Reading an illustrative mass-for-age percentile chart
| Series | Age (months) | Mass (kg) |
|---|---|---|
| Illustrative 25th percentile | 0 | 3 |
| Illustrative 25th percentile | 3 | 5 |
| Illustrative 25th percentile | 6 | 6.5 |
| Illustrative 25th percentile | 9 | 8 |
| Illustrative 25th percentile | 12 | 9 |
| Illustrative 50th percentile | 0 | 3.5 |
| Illustrative 50th percentile | 3 | 6 |
| Illustrative 50th percentile | 6 | 7.5 |
| Illustrative 50th percentile | 9 | 9 |
| Illustrative 50th percentile | 12 | 10 |
In this illustration, a fictional child aged 6 months with a mass of 6.5 kg lies on the 25th-percentile line. Their mass is therefore greater than that of approximately one quarter of the comparison group of the same age.
If this child previously had a mass of 5 kg at 3 months, both measurements lie on the same percentile line. Their mass has increased, but their position relative to the comparison group has remained similar. Following a percentile line does not mean staying the same mass: the line rises as children grow.
Repeated measurements show a growth pattern more clearly than one measurement. Children may fluctuate around a percentile line, particularly when young. However, a marked change away from their previous pattern can be a reason for further assessment.
Growth charts can help identify possible concerns such as malnutrition or obesity. Comparing different measurements can also reveal an unusual pattern, such as a relatively large body size alongside a small head circumference. A chart highlights a possible concern; it does not diagnose the cause on its own.
For real monitoring, use an appropriate growth chart based on reference data, rather than the constructed illustration here. The same reading method applies: locate the measurement, identify its percentile and compare successive measurements to assess the trend.
Get unlimited access to all revision notes, key terms, and exam tips.
Get unlimited access to all revision notes, key terms, and exam tips.
Distinguish the processes: cell division increases cell number, elongation increases cell length, and differentiation produces specialised cells.
The 25th percentile does not mean that a child has 25% of the average mass. It compares the child with others of the same age.
Check the axes and units before reading a growth chart, and use the appropriate chart for the child's age and sex.
Assess growth using measurements over time. A single high or low percentile does not, by itself, show a health problem.
Growth
A permanent increase in the size or mass of an organism.
Cell division
The production of new cells from an existing cell. In growth, division involving mitosis increases the number of body cells.
Cell differentiation
The process by which a cell develops specialised structures that enable it to carry out a particular function.
Cell elongation
An increase in a cell's length, which contributes to growth in plants.
Specialised cell
A cell with structural adaptations that enable it to perform a particular function within an organism.
Percentile
A value below which a stated percentage of a reference population falls. For example, the 25th percentile for mass is the mass below which approximately 25% of the comparison group falls.
Put your knowledge into practice — try past paper questions for Combined Science
Growth
A permanent increase in the size or mass of an organism.
Cell division
The production of new cells from an existing cell. In growth, division involving mitosis increases the number of body cells.
Cell differentiation
The process by which a cell develops specialised structures that enable it to carry out a particular function.
Cell elongation
An increase in a cell's length, which contributes to growth in plants.
Specialised cell
A cell with structural adaptations that enable it to perform a particular function within an organism.
Percentile
A value below which a stated percentage of a reference population falls. For example, the 25th percentile for mass is the mass below which approximately 25% of the comparison group falls.