

Loading…
Loading…
Loading…
AQA GCSE Statistics · 8382
AQA 8382 · 3.3.2 Advanced Pictorial Representations Check the specification (PDF) (opens in a new tab)
A pictorial display makes patterns easier to see, but its meaning comes from its labels and scales. Before interpreting one, identify the population or area, the date, the categories and the quantity represented. A bar might show a number of people or a percentage; a shaded region might represent a range rather than an exact value.
A useful comparison combines a clear statement with numerical evidence. Rather than saying that two displays look different, explain which group or region differs, by how much where possible, and what that tells you.
A population pyramid shows the distribution of a population across age groups. It usually has horizontal bars extending from a central age axis, with males on one side and females on the other. The labels tell you which side is which. Older age groups normally appear above younger ones.
Read an age-group label first, then follow its bar to the horizontal scale. A longer bar represents more people or a larger percentage. Bars extending to the left do not represent negative populations: their direction simply separates the two sides.
The name does not mean every diagram must have a triangular shape. Its shape depends on the age distribution. Relatively long bars near the bottom indicate a large younger share; relatively long bars higher up indicate a large older share.
Suppose two towns have the age distributions shown below. Every bar gives a percentage of that town's whole population, so the percentages across both sides together total 100%.
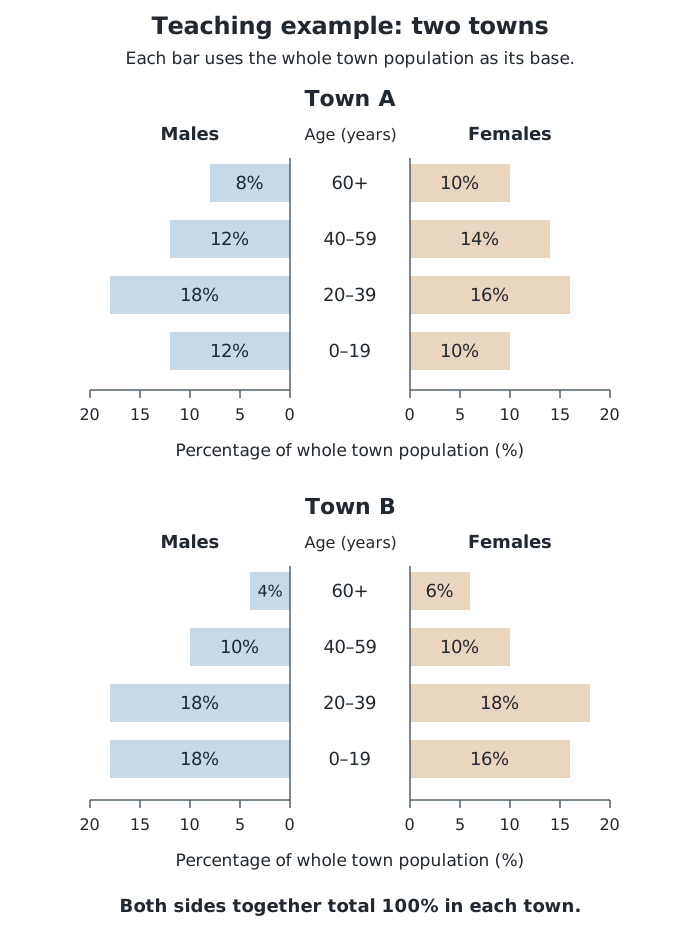
Compare corresponding age groups using the same scale. Each bar represents a percentage of the whole town population.
In Town A, the female bar for ages 40–59 represents 14% of the whole population. To find the percentage aged under 20, combine the male and female bars: . To find the percentage aged 40 or over, combine all four bars in the two oldest groups: .
These additions work because the age groups do not overlap and all the percentages use the same population as their base.
Town B has a larger proportion aged under 20: 34%, compared with 22% in Town A. That is a difference of 12 percentage points. Town A has a larger proportion aged 40 or over: 44%, compared with 30% in Town B. These figures support the conclusion that Town A has a relatively older age distribution.
Percentages compare the composition of populations, not necessarily their numbers of people. Suppose Town A has 20,000 residents and Town B has 40,000. The estimated numbers aged under 20 are and respectively. The population totals are needed to convert proportions into counts.
Always establish the base of a percentage. In Town A, males aged 60 or over make up 8% of the whole population. Males of all ages make up 50%, so that same older male group represents of the male population. These percentages describe the same group using different bases.
If a pyramid instead gives percentages of the male and female populations separately, adding a male percentage to a female percentage does not directly give a percentage of the whole population. The sizes of the two populations matter.
Rounded percentages also limit precision. Multiplying a rounded percentage by a population total estimates a count; several different exact counts may produce the same rounded percentage.
A choropleth map represents data for different regions using colours, shades or patterns. Its key links each appearance to a value or interval. On a black-and-white display, grey shades or hatching can distinguish the categories. Never assume what a dark region means without reading the key.
To read a region, identify its shading and match it to the key. If its category is 40–59 people, you know its count lies in that interval, not that it equals 40, 50 or 59. Two regions with the same shading can therefore have different exact values.
A choropleth need not show a detailed geographical outline. A grid can represent equal-sized sections of a space. Suppose a festival field is divided into nine equal-area squares, and people are counted at two times. The diagrams below group those counts into intervals.
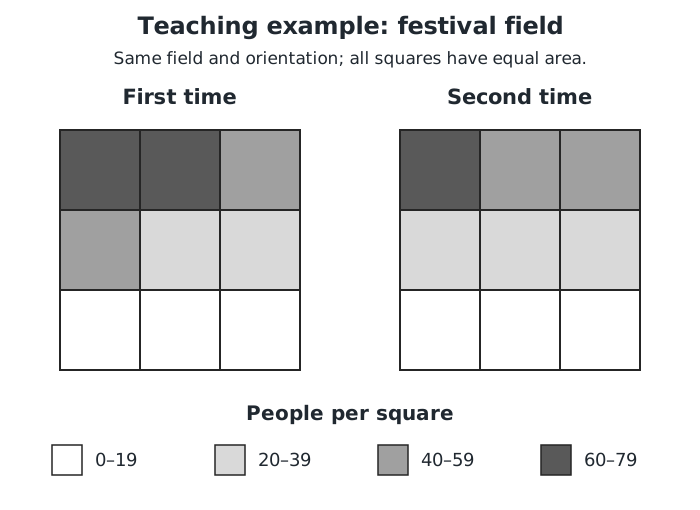
The same key is used at both times. Shading shows a count interval, not an exact count.
The top row has the highest counts at both times. If a popular performance is taking place, this concentration would support a suggestion that the stage is near the top edge: people may gather close to the performers. That is a reasoned suggestion, not proof of the stage's location.
The equal areas make the comparison especially straightforward: more people in a square also means a greater concentration of people there. For regions of different sizes, check what the key measures before interpreting a large shaded area as a large concentration.
The two field diagrams use the same regions and the same key. Between the first and second times, the top-middle square changes from the 60–79 category to the 40–59 category. Its count has decreased, although the shading alone does not reveal the exact decrease.
The bottom-middle square stays in the 0–19 category. This does not establish that its count stayed the same: a change can occur without crossing a category boundary.
When comparing choropleth maps, check that they measure the same quantity, use comparable regions and refer to relevant dates. Check their keys independently. If one map's darkest shade means 40–59 and another's means 60–79, matching colours do not mean matching values.
Look for clusters of high or low categories and contrasts between neighbouring regions. State the visible pattern first, then explain any suggested interpretation. A choropleth summarises regional data; it does not show the precise value at every point within a region or establish the cause of a pattern.
A larger percentage need not mean more people. Rounded percentages produce estimated counts.
Name the groups or regions, give supporting values or intervals, and state the conclusion. Distinguish an observed pattern from a suggested explanation.
Check whether a population pyramid gives frequencies, percentages of the whole population or percentages of each male/female population.
For a combined age range, add all the relevant bars, including both sides if the question asks about everyone.
Support comparisons with figures and name the populations, age groups or regions being compared.
Read each choropleth key separately: the same shade on two maps may represent different intervals.
Rounded percentages give estimated counts, not necessarily exact counts. A displayed 0.0% need not mean nobody is in that group.
It can see this note and what your specification asks for.
Answers are free with an account.
1 free note left this week
Get more free notesYour answer sets when this note comes back for review, or marks it complete.
Was this note helpful?
Log in to tell us whether it helped, or to report a problem.
Last updated
Population pyramid
A diagram showing how a population is distributed across age groups, usually with male and female populations shown on opposite sides.
Choropleth map
A map or spatial diagram in which regions are shaded, coloured or patterned according to the data category they belong to.
Key
A guide explaining what the colours, shades, patterns or symbols in a diagram represent.
Frequency
The number of observations or people in a category.
Percentage point
A difference between percentages, found by subtracting one percentage from another. For example, 34% is 12 percentage points higher than 22%.
Put your knowledge into practice — try past paper questions for Statistics
Population pyramid
A diagram showing how a population is distributed across age groups, usually with male and female populations shown on opposite sides.
Choropleth map
A map or spatial diagram in which regions are shaded, coloured or patterned according to the data category they belong to.
Key
A guide explaining what the colours, shades, patterns or symbols in a diagram represent.
Frequency
The number of observations or people in a category.
Percentage point
A difference between percentages, found by subtracting one percentage from another. For example, 34% is 12 percentage points higher than 22%.