Loading…


Loading…
Loading…
Loading…
AQA GCSE Combined Science Trilogy · 8464
AQA 8464 · 4.7.2.1 Levels of Organization and Trophic Relationships Check the specification (PDF) (opens in a new tab)
Understand that photosynthetic organisms serve as the primary producers of all biomass for life on Earth.
Describe how feeding relationships within a community are accurately represented by food chains, always beginning with a producer that synthesises molecules.
Explain that producers are typically green plants or algae that manufacture glucose through the process of photosynthesis.
Understand how ecologists utilise experimental methods, specifically transects and quadrats, to determine the precise distribution and abundance of species in an ecosystem.
Understand the mathematical terms mean, mode, and median in the context of analysing the abundance of organisms.
Calculate arithmetic means from ecological sampling data.
Plot and draw appropriate graphs by selecting appropriate scales for the axes based on biological data.
Explain the flow of energy from producers to primary consumers, followed by secondary and tertiary consumers.
Describe predators as consumers that actively kill and eat other animals, and identify the eaten animals as prey.
Understand that in a stable community, the numbers of predators and prey will rise and fall in predictable cycles.
Interpret graphs designed to mathematically model these predator-prey population cycles.
Evaluate methods for measuring the population size of a common species in a natural habitat.
Assess the effect of an environmental factor on the distribution of a species using appropriate sampling techniques.
A community consists of populations of different species living together. Its organisms depend on one another, including through feeding relationships. To understand these relationships, start with where their food comes from.
Biomass is the biological material that makes up living organisms. Photosynthetic organisms produce the biomass that supports food chains and life on Earth. They are called producers because they synthesise — make — biological molecules rather than obtaining them by eating other organisms.
A producer is usually a green plant or an alga. Through photosynthesis, it uses light energy from the Sun to make glucose from carbon dioxide and water. The glucose can be used to make other biological molecules, building the producer's biomass. When another organism eats the producer, it obtains material and energy from this food. This connects sunlight, photosynthesis and the feeding relationships within a community.
A food chain represents a sequence of feeding relationships. It begins with a producer, followed by consumers: organisms that obtain food by eating other organisms.
For example, a pond food chain is:
Algae → tadpoles → small fish → kingfisher
The algae are the producer. Tadpoles eat the algae, so they are primary consumers. Small fish eat the tadpoles, making them secondary consumers. The kingfisher eats the small fish, so it is a tertiary consumer in this chain.
Each arrow points from the food to the organism eating it. The arrow from tadpoles to small fish therefore means that the fish eat the tadpoles. It shows the direction in which material and energy are transferred, not the direction in which a predator moves when hunting.
A shorter chain is grass → rabbit → fox. Here, grass is the producer, the rabbit is the primary consumer and the fox is the secondary consumer. A food chain does not have to contain a tertiary consumer: the labels describe positions in the particular feeding sequence.
A predator is a consumer that kills and eats other animals. The animals it eats are its prey. In the grass–rabbit–fox chain, the fox is a predator and the rabbit is its prey. In the pond chain, a small fish is a predator of tadpoles but also prey for a kingfisher. An animal can therefore be both predator and prey.
Prey numbers affect predators because prey provide food. Predator numbers affect prey because predators kill them. These two effects link the populations together.
In a stable community, predator and prey populations can rise and fall in repeating cycles. Stability does not mean that the number of every organism stays unchanged.
Imagine that rabbit numbers increase. More rabbits provide more food for foxes, allowing more foxes to survive and reproduce. The fox population increases, but this takes time: extra food does not instantly produce more adult foxes.
With more foxes hunting, more rabbits are eaten and rabbit numbers fall. There is then less food available for the foxes, so fewer survive or reproduce and fox numbers fall too. With fewer foxes, fewer rabbits are eaten. The rabbit population can recover, providing more food for foxes again, and the cycle repeats.
This delay means that the predator population usually reaches its peak after the prey population in a simple predator–prey model.
The graph below is an illustration of this pattern. Its horizontal axis shows time in months, and its vertical axis shows the number of organisms in each population.
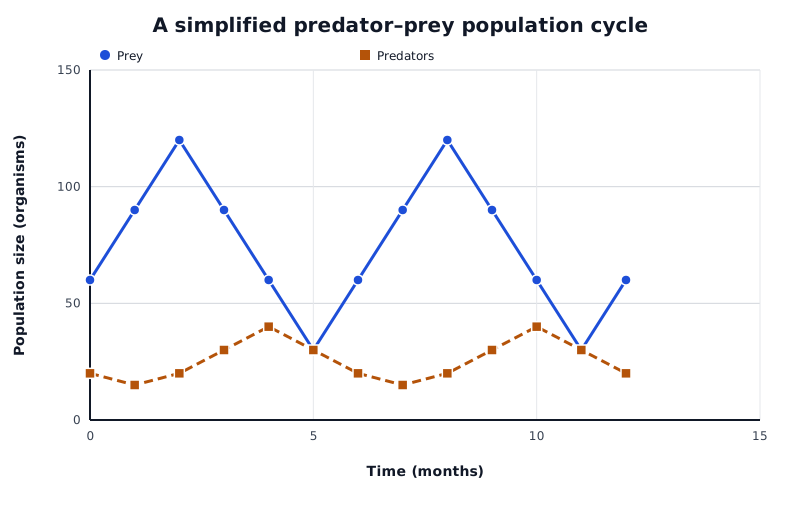
Population counts showing repeating cycles: predator peaks follow prey peaks.
Data for A simplified predator–prey population cycle
| Series | Time (months) | Population size (organisms) |
|---|---|---|
| Prey | 0 | 60 |
| Prey | 1 | 90 |
| Prey | 2 | 120 |
| Prey | 3 | 90 |
| Prey | 4 | 60 |
| Prey | 5 | 30 |
| Prey | 6 | 60 |
| Prey | 7 | 90 |
| Prey | 8 | 120 |
| Prey | 9 | 90 |
| Prey | 10 | 60 |
| Prey | 11 | 30 |
| Prey | 12 | 60 |
| Predators | 0 | 20 |
| Predators | 1 | 15 |
| Predators | 2 | 20 |
| Predators | 3 | 30 |
| Predators | 4 | 40 |
| Predators | 5 | 30 |
| Predators | 6 | 20 |
| Predators | 7 | 15 |
| Predators | 8 | 20 |
| Predators | 9 | 30 |
| Predators | 10 | 40 |
| Predators | 11 | 30 |
| Predators | 12 | 20 |
Begin with the labels and key so that you know which line represents each population. Then follow each line from left to right, looking for increases, decreases, peaks and troughs.
In this illustration, the prey population reaches a peak of 120 organisms at month 2. The predator population peaks later, at 40 organisms at month 4: a delay of two months. The prey peak provides more food, supporting the later increase in predators. By month 4, prey numbers have already fallen to 60 while predator numbers are at their highest.
The prey population reaches a trough at month 5. The predator population reaches its next trough at month 7, after the reduced food supply has affected its numbers. Prey numbers then recover as there are fewer predators eating them.
The same sequence repeats, with prey peaking at month 8 and predators at month 10. To interpret another graph, use its actual times and values rather than assuming this exact delay or cycle length. Real communities contain other influences, so this simple model helps explain a relationship without predicting every population change.
Get unlimited access to all revision notes, key terms, and exam tips.
More prey → more food for predators → more predators → more prey eaten → fewer prey → less food for predators → fewer predators → prey recover.
A predator kills and eats other animals; those animals are its prey. An animal can be both predator and prey.
Get unlimited access to all revision notes, key terms, and exam tips.
Draw food-chain arrows from the organism being eaten towards the organism that eats it: they show the direction of energy and material transfer.
Identify consumer levels by following the chain from the producer, not simply by recognising the animal.
When explaining a population change, link it to food availability or the number of prey being eaten, then explain the effect on survival and reproduction.
Use values and times from a graph to support your interpretation. Check whether the two populations use the same vertical scale.
A stable community does not have completely constant populations: predator and prey numbers can fluctuate in repeating cycles.
Biomass
The biological material that makes up living organisms.
Producer
An organism that makes biological molecules rather than obtaining them by eating other organisms; usually a green plant or alga that makes glucose by photosynthesis.
Photosynthesis
The process by which plants and algae use light energy to make glucose from carbon dioxide and water, releasing oxygen.
Food chain
A representation of feeding relationships in which arrows show the transfer of material and energy from one organism to another.
Consumer
An organism that obtains food by eating other organisms.
Primary consumer
A consumer that eats a producer.
Secondary consumer
A consumer that eats a primary consumer.
Tertiary consumer
A consumer that eats a secondary consumer.
Predator
A consumer that kills and eats other animals.
Prey
An animal that is eaten by a predator.
Stable community
A community in which species and environmental conditions remain sufficiently balanced over time, although population sizes may fluctuate.
Put your knowledge into practice — try past paper questions for Combined Science Trilogy
Biomass
The biological material that makes up living organisms.
Producer
An organism that makes biological molecules rather than obtaining them by eating other organisms; usually a green plant or alga that makes glucose by photosynthesis.
Photosynthesis
The process by which plants and algae use light energy to make glucose from carbon dioxide and water, releasing oxygen.
Food chain
A representation of feeding relationships in which arrows show the transfer of material and energy from one organism to another.
Consumer
An organism that obtains food by eating other organisms.
Primary consumer
A consumer that eats a producer.
Secondary consumer
A consumer that eats a primary consumer.
Tertiary consumer
A consumer that eats a secondary consumer.
Predator
A consumer that kills and eats other animals.
Prey
An animal that is eaten by a predator.
Stable community
A community in which species and environmental conditions remain sufficiently balanced over time, although population sizes may fluctuate.