

Loading…
Loading…
Loading…
OCR GCSE Combined Science B · J260
OCR J260 · Photosynthetic Processes and Rates Check the specification (PDF) (opens in a new tab)
Photosynthesis uses light energy to make glucose from carbon dioxide and water. Its rate describes how much happens in a given time. Rather than measuring glucose directly, an investigation can track oxygen production or carbon dioxide uptake.
Three important environmental conditions affect this rate: light intensity, carbon dioxide concentration and temperature. They work together. A plant may have plenty of carbon dioxide, but it cannot photosynthesise rapidly if too little light reaches it.
A limiting factor is a condition that restricts the rate. Increasing that factor increases the rate, until something else prevents a further increase. Which factor is limiting can therefore change as conditions change.
Light intensity: light supplies energy for photosynthesis. At low intensity, increasing the light usually increases the rate because more energy is available. Eventually the rate levels off: extra light cannot overcome a shortage of carbon dioxide or a restriction caused by temperature.
Carbon dioxide concentration: carbon dioxide is a reactant used to make glucose. When it is in short supply, increasing its concentration increases the rate. The curve eventually reaches a plateau when another factor limits the process.
Temperature: photosynthesis includes enzyme-catalysed reactions. At low temperatures these reactions are slow because there are fewer successful collisions between enzymes and substrates. Warming increases molecular movement and successful collisions, so the rate increases towards an optimum. Above the optimum, enzymes can denature: changes to their active sites reduce their ability to catalyse reactions, and photosynthesis slows. A graph therefore rises towards a maximum and then falls at high temperatures. Increasing temperature does not always increase the rate.
These trends describe what happens when the factor being changed can affect the rate. For example, warming a plant in very dim light may have little effect because its shortage of light energy remains the main restriction.
A graph of photosynthesis rate against light intensity can contain several curves, each representing a different temperature or carbon dioxide concentration. Read the axes first, then the conditions attached to each curve.
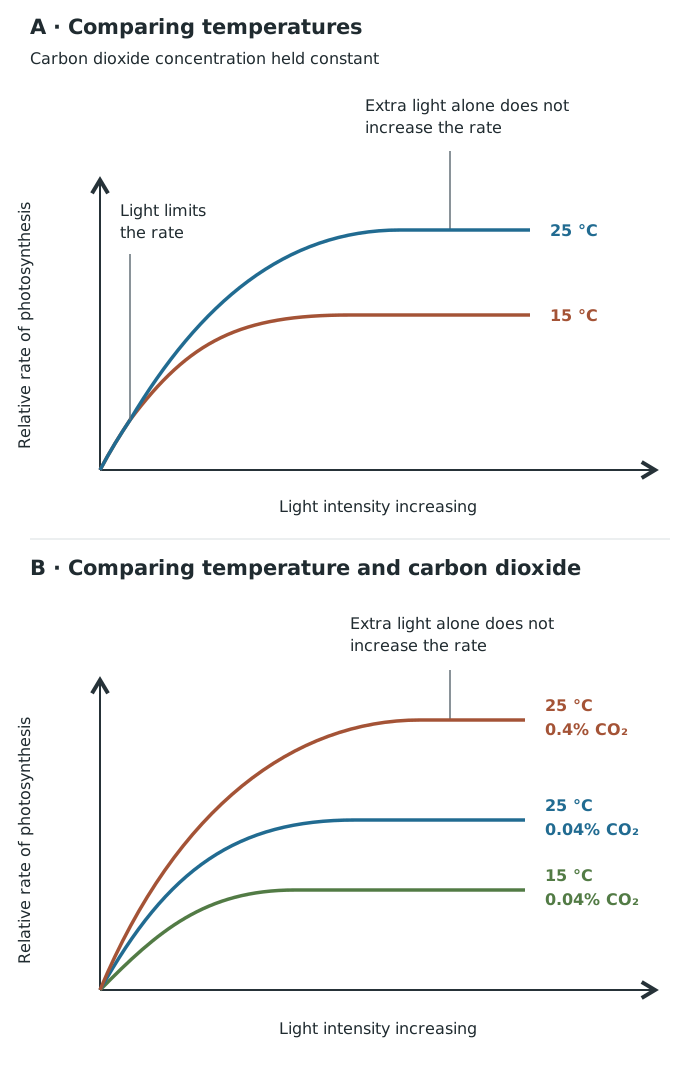
Changing another condition can raise the rate once extra light alone has little effect.
In the temperature comparison, the curves are close together at very low light intensity. Both plants have too little light energy, so the temperature difference makes little difference to the rate. At higher light intensity, the curve at 25 °C lies above the curve at 15 °C: under these conditions, the warmer plant can photosynthesise faster. This is not evidence that 25 °C is the optimum temperature for every plant.
The three-condition comparison separates the effects of temperature and carbon dioxide. At high light intensity, compare the two curves at 25 °C: the higher plateau at 0.4% carbon dioxide, compared with 0.04%, shows that carbon dioxide availability restricted the lower rate. Comparing 15 °C and 25 °C at 0.04% carbon dioxide shows that temperature also affects the rate.
A plateau means that increasing light intensity alone no longer increases photosynthesis. To identify the remaining restriction, examine what happens when another condition changes. A plant has not stopped photosynthesising at a plateau; it continues at an approximately constant rate.
One school method uses pondweed, such as Hydrilla, and measures the volume of oxygen released in a fixed time. More oxygen collected per unit time indicates a faster rate of photosynthesis. Sodium hydrogencarbonate dissolved in the water supplies carbon dioxide.
Use a piece of pondweed, a boiling tube, prepared sodium hydrogencarbonate solution, a beaker of water, thermometer, lamp, ruler, stop clock and a graduated inverted pipette held by a stand and clamp. The pipette collects gas above the pondweed; tubing and a clip allow it to be filled and sealed.
If moving the lamp closer increases oxygen production per unit time, the additional light has increased photosynthesis. If the rate levels off despite further increases in light intensity, another factor is limiting.
Each collection ends after its planned time, not when bubbling stops. Wear eye protection, handle glassware carefully, wash hands afterwards and avoid touching the hot lamp. Keep the apparatus stable and electrical connections dry. Measuring gas volume is preferable to simply counting bubbles because bubbles can differ in size.
The same pondweed oxygen-collection apparatus can investigate carbon dioxide availability by changing the concentration of sodium hydrogencarbonate solution rather than moving the lamp.
These percentages describe the sodium hydrogencarbonate solutions, not measured percentages of carbon dioxide. More concentrated solutions supply more carbon dioxide. A rising rate followed by a plateau shows that increasing this supply helps initially, but another factor eventually restricts the rate. Repeating the concentration series at a higher light intensity can test whether light caused that restriction.
To investigate temperature, use water baths at different controlled temperatures with the same oxygen-collection method. Allow the pondweed and solution to reach each chosen temperature before taking readings. Keep light intensity and sodium hydrogencarbonate concentration constant, as well as pondweed size, solution volume and collection time. Repeat measurements and calculate mean rates. Plot mean oxygen production rate against temperature: temperature on the horizontal axis and rate on the vertical axis. Look for a rise towards an optimum and a decline at higher temperatures.
Use the same safety precautions as for the light investigation, and take care with hot water. End each collection after its planned time and never mouth-pipette.
Light spreads out as it travels away from a source. The relationship used here is:
Here, is light intensity and is distance from the source. For the same lamp, two positions can be compared using:
For example, moving a plant from 20 cm to 40 cm gives an intensity ratio of : it receives one-quarter of the original intensity. Moving it three times as far away gives one-ninth of the intensity.
If light is limiting and photosynthesis rate is proportional to light intensity, doubling distance would also reduce the rate to about one-quarter. That prediction does not apply once another factor limits the rate. Use consistent distance units throughout the calculation. In a school investigation, a light meter helps check the actual intensity because other light sources and the lamp's shape can affect it.
A rate combines an amount with a time:
Suppose an oxygen-collection investigation produces 6 cm³ of oxygen in 3 minutes. The mean production rate is cm³/min. Dividing by time allows results collected over different durations to be compared fairly.
Suppose the following results are used to practise plotting. Each oxygen volume represents production over 2 minutes, with temperature and carbon dioxide concentration kept constant.
| Relative light intensity / arbitrary units | Oxygen volume / cm³ | Mean oxygen production rate / cm³/min |
|---|---|---|
| 1 | 2 | 1 |
| 2 | 4 | 2 |
| 3 | 6 | 3 |
| 4 | 7 | 3.5 |
| 5 | 7 | 3.5 |
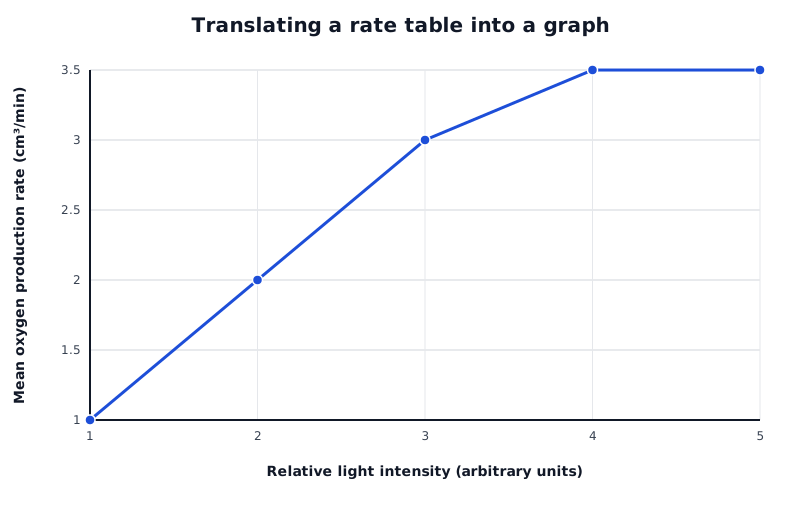
The rate initially increases with light intensity, then reaches a plateau.
Data for Translating a rate table into a graph
| Series | Relative light intensity (arbitrary units) | Mean oxygen production rate (cm³/min) |
|---|---|---|
| Mean oxygen production rate | 1 | 1 |
| Mean oxygen production rate | 2 | 2 |
| Mean oxygen production rate | 3 | 3 |
| Mean oxygen production rate | 4 | 3.5 |
| Mean oxygen production rate | 5 | 3.5 |
Put the independent variable, light intensity, on the horizontal axis and the dependent variable, rate, on the vertical axis. Choose evenly spaced scales that use much of the plotting area. For these data, horizontal intervals of 1 arbitrary unit and vertical intervals of 0.5 cm³/min would work. Label both axes with quantities and units, plot each coordinate carefully, then draw a suitable best-fit line or curve showing the overall trend.
To read a rate from the graph, move vertically from the chosen light intensity to the curve, then horizontally to the rate axis. For example, the table and graph both give 3 cm³/min at an intensity of 3 arbitrary units. Multiplying that rate by the 2-minute collection time gives the corresponding volume of 6 cm³.
The rate rises initially, then remains at 3.5 cm³/min between intensities 4 and 5. That plateau supports the conclusion that additional light no longer increases the rate under these conditions; it does not identify the new limiting factor.
Identify a limiting factor from the response to changing it: if increasing it raises the rate, it was limiting under those conditions.
A plateau shows that light is no longer limiting; it does not, by itself, identify which other factor is limiting.
Compare curves at the same light intensity, and check which conditions differ before explaining the difference.
Square the distance in inverse square calculations. Doubling distance gives one-quarter of the light intensity, not one-half.
Only predict that photosynthesis rate follows the inverse square law when light is the limiting factor.
Give rate units that include time, and label graph axes with the quantity and its unit.
Sodium hydrogencarbonate solution supplies carbon dioxide, but its percentage concentration is not the same as the carbon dioxide concentration.
It can see this note and what your specification asks for.
Answers are free with an account.
1 free note left this week
Get more free notesYour answer sets when this note comes back for review, or marks it complete.
Was this note helpful?
Log in to tell us whether it helped, or to report a problem.
Last updated
Rate of photosynthesis
The amount of photosynthesis taking place per unit time, estimated by measuring a change such as oxygen production or carbon dioxide uptake over a known time.
Limiting factor
A condition that restricts the rate of a process; improving that condition increases the rate until another condition becomes limiting.
Light intensity
The amount of light energy reaching a given area per unit time.
Inverse square law
The relationship in which light intensity is inversely proportional to the square of distance from a light source: .
Optimum temperature
The temperature at which a process has its highest rate under the conditions being investigated.
Control variable
A variable kept the same during an investigation so that its effect does not obscure the effect of the independent variable.
Put your knowledge into practice — try past paper questions for Combined Science B
Rate of photosynthesis
The amount of photosynthesis taking place per unit time, estimated by measuring a change such as oxygen production or carbon dioxide uptake over a known time.
Limiting factor
A condition that restricts the rate of a process; improving that condition increases the rate until another condition becomes limiting.
Light intensity
The amount of light energy reaching a given area per unit time.
Inverse square law
The relationship in which light intensity is inversely proportional to the square of distance from a light source: .
Optimum temperature
The temperature at which a process has its highest rate under the conditions being investigated.
Control variable
A variable kept the same during an investigation so that its effect does not obscure the effect of the independent variable.
Twice the distance → one-quarter of the intensity. Rate follows this relationship only while light is limiting.
Plot the independent variable on the horizontal axis and rate on the vertical axis. Use labelled units, regular scales and a suitable best-fit line or curve. Multiply rate by time to recover the amount produced.