

Loading…
Loading…
Loading…
Eduqas GCSE Geography B · C112
Eduqas C112 · 4.1 Graph Construction and Selection Check the specification (PDF) (opens in a new tab)
Select and construct appropriate charts and graphs using accurate scales to present geographical data.
Create bar charts, line charts, climate graphs, and hydrographs to represent temporal and continuous data.
Construct pie charts, pictograms, and proportional circles to display categorical data proportions.
Develop histograms with equal class intervals, dispersion graphs, and scatter graphs to analyze distributions.
Construct specialized geographical graphics including star graphs, radial graphs, kite diagrams, and triangular graphs.
Geographical data often contain categories, such as methods of travelling to school or types of vehicle counted on a road. Different charts reveal different aspects of these data. A pie chart shows how a total is divided between categories. A pictogram shows category frequencies using repeated symbols. Proportional circles compare quantities through the areas of circles; they can also be placed on a base map to show differences between locations.
The choice depends on the question. To show the share of journeys made by bus, a pie chart is useful. To compare numbers of cyclists at several sites, a pictogram or proportional circles may be clearer. Proportional circles do not have to represent percentages: they can show totals such as population or traffic counts.
A pie chart represents the whole dataset with a complete circle. Each category occupies a sector, whose angle is proportional to its share of the total. Because a circle contains 360°, calculate each angle using:
If the data are already percentages, use:
Suppose a survey records 40 journeys to school: 20 walking, 10 by bus, 6 cycling and 4 by car. The walking journeys make up half the total, so their sector occupies half the circle: .
| Travel method | Number of journeys | Percentage | Sector angle |
|---|---|---|---|
| Walking | 20 | 50% | 180° |
| Bus | 10 | 25% | 90° |
| Cycling | 6 | 15% | 54° |
| Car | 4 | 10% | 36° |
| Total | 40 | 100% | 360° |
To draw the chart, use a compass to draw a circle and mark its centre. Draw a radius from the centre to the top of the circle. Place the centre of a protractor over the circle’s centre, align it with this radius, and measure the first sector angle. Draw the next radius through that mark. Measure each new sector from the previous boundary, continuing around the circle.
Use distinct colours or shading for the categories and add a key or direct labels. Give the chart a title identifying what the data describe. The completed sectors should fill the circle without gaps or overlaps. Handle the sharp compass point carefully.
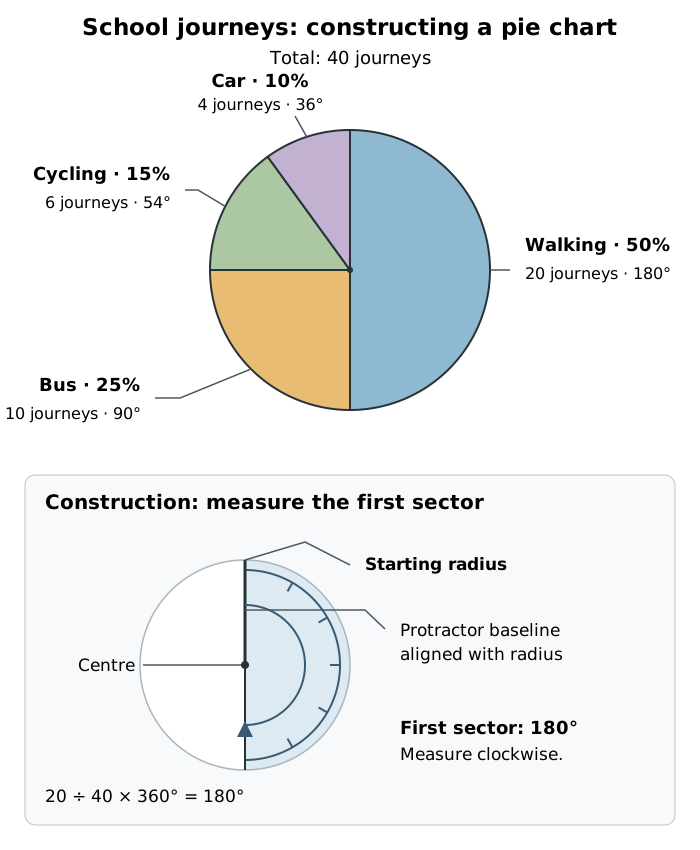
Each sector’s angle represents its share of the 40 journeys.
Walking accounts for the largest share in this example: 50%. Cycling and car journeys together account for 25%, the same share as bus journeys. The chart makes these proportions visible, while the labels provide precise values.
Pie charts work well when a small number of categories divide a meaningful whole. Too many small sectors make them difficult to read, and similar-sized sectors can be hard to compare accurately.
Equal-sized pie charts compare proportions, not total quantities. A 50% walking sector could represent 20 journeys out of 40 or 100 journeys out of 200. Without the totals, the reader cannot tell which survey recorded more journeys. Label the totals when that distinction matters. A proportional pie chart can show both: the circle’s area represents the total, while its sectors represent the category shares.
A pictogram uses repeated pictures or symbols to show frequencies. Its key states how many items one complete symbol represents. Choose a value that keeps the chart compact but allows any partial symbols to be drawn clearly.
Suppose cyclists counted during equal observation periods at three sites total 10, 6 and 4. Choose a key of one full symbol representing 4 cyclists. Calculate the number of symbols using:
Site A needs symbols: two full symbols and a half. Site B needs one and a half symbols, while Site C needs one full symbol. A half-symbol represents 2 cyclists because it carries half the value of a full symbol.
Arrange the symbols in labelled rows, aligned from a common starting point. Keep every full symbol the same size and leave consistent spaces between them. Include the key and a title stating what was counted.
To read the chart, count the full and partial symbols, then multiply by the key value. For Site A, two full symbols represent 8 cyclists and the half-symbol represents 2, giving 10 in total.
Pictograms are accessible and useful for comparing a few category frequencies. However, very large counts can require too many symbols, and awkward fractions can make a chart difficult to draw or interpret. Changing the key can improve readability.
Proportional circles represent quantities by area. A circle representing twice the quantity must have twice the area, not twice the radius. This matters because doubling a circle’s radius makes its area four times as large.
Choose one quantity and a convenient radius as your reference. Since the area of a circle is , the radius for another quantity follows:
Suppose two sites record 40 and 160 vehicles during equal counting periods. Choose a radius of 1 cm for 40 vehicles. The second count is four times larger, so its circle needs four times the area. Its radius is cm.
Draw the circles with a compass, label the sites, and provide a size key showing the quantities represented by example circles. The key must use exactly the same scale as the plotted circles: its 40-vehicle circle must match the size of the plotted 40-vehicle circle, and likewise for 160 vehicles. This lets readers match circle sizes to quantities. If drawing them on a base map, centre each circle on its correct location and retain a clear map scale and location labels.
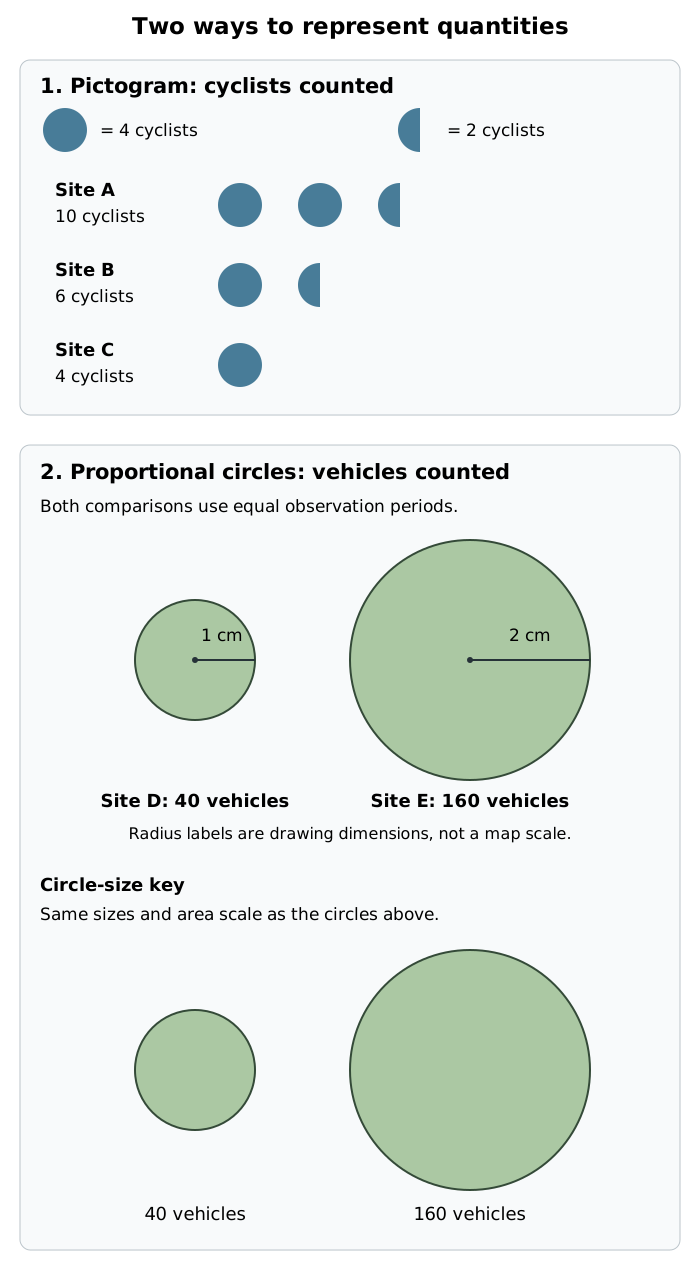
Pictograms vary the number of equal-sized symbols; proportional circles vary their area. Size-key circles match the plotted circles for the same quantities.
The larger circle shows that the second traffic count is four times the first. It does not show the proportions of different vehicle types unless it is also divided into pie-chart sectors.
Proportional circles make large differences in quantity easy to recognise, especially when placed at locations on a map. Their limitations are that similar circle areas can be difficult to judge and large circles may overlap, hiding smaller ones or map detail. A labelled value or a supporting table can make exact comparisons easier.
Whether you draw by hand or use software, the important choices remain the same: use a technique suited to the data, apply a consistent scale, and make the title, labels and key clear. When transferring these methods to real geographical data, check that you are comparing like with like—for example, traffic counts collected over equal lengths of time.
For a pie chart, divide by the total before multiplying by 360. Percentages must total 100% and sector angles must total 360°, allowing for rounding.
Give every chart an explanatory title and a clear key or labels. Include the units represented by each pictogram symbol or proportional circle.
Keep full pictogram symbols the same size. Show a fractional value using the appropriate fraction of a symbol, not a smaller whole symbol.
For proportional circles, scale the area, not the radius: four times the value needs twice the radius. Size-key circles must use exactly the same scale as the circles in the chart.
Justify your choice by explaining what the technique shows clearly, rather than simply saying that it looks attractive.
It can see this note and what your specification asks for.
Answers are free with an account.
1 free note left this week
Get more free notesYour answer sets when this note comes back for review, or marks it complete.
Was this note helpful?
Log in to tell us whether it helped, or to report a problem.
Last updated
Pie chart
A chart in which a circle is divided into sectors to show each category’s share of a total.
Sector
A wedge-shaped part of a circle, bounded by two radii and an arc. Its angle represents a category’s share of the total in a pie chart.
Pictogram
A chart that uses repeated pictures or symbols to represent the frequency of each category, with a key stating the value of one full symbol.
Proportional circle
A circle whose area is scaled in proportion to the quantity it represents.
Frequency
The number of observations or items in a category.
Categorical data
Data grouped into distinct categories, such as travel method or vehicle type.
Put your knowledge into practice — try past paper questions for Geography B
Pie chart
A chart in which a circle is divided into sectors to show each category’s share of a total.
Sector
A wedge-shaped part of a circle, bounded by two radii and an arc. Its angle represents a category’s share of the total in a pie chart.
Pictogram
A chart that uses repeated pictures or symbols to represent the frequency of each category, with a key stating the value of one full symbol.
Proportional circle
A circle whose area is scaled in proportion to the quantity it represents.
Frequency
The number of observations or items in a category.
Categorical data
Data grouped into distinct categories, such as travel method or vehicle type.
For percentages: .
Draw with a compass and protractor; add a title and category labels or key. Angles total 360°. Equal-sized pies compare shares, not totals.
Read by multiplying the number of full and partial symbols by the key value. Use labelled rows and a clear key. Awkward fractions and very large counts reduce readability.
Area is proportional to quantity. Four times the value means twice the radius.
Use one consistent scale for plotted circles and size-key circles, with location labels. On maps, centre circles on their locations. Overlap and similar areas can make comparison difficult.