

Loading…
Loading…
Loading…
Eduqas GCSE Geography B · C112
Eduqas C112 · 2.3.3 Distribution of Weather Hazards Check the specification (PDF) (opens in a new tab)
Atmospheric pressure is the force exerted by air per unit area of a surface. Weather charts usually show pressure adjusted to sea level, measured in hectopascals (hPa). One hectopascal equals one millibar. Standard sea-level pressure is about 1013 hPa, but a high or low is defined by comparison with its surroundings, not by a single fixed threshold.
Air movement connects pressure to weather. Where air rises, low pressure develops at the surface. As the rising air cools, water vapour can condense into droplets, forming clouds and precipitation. Where air sinks, high pressure develops. Descending air warms, making condensation less likely and reducing cloud formation.
These relationships explain why depressions, or low-pressure systems, usually bring unsettled weather, while anticyclones, or high-pressure systems, usually bring more settled conditions.
Uneven heating drives large-scale atmospheric circulation. The important connection here is between the rising and sinking parts of that circulation and surface pressure. From the equator towards either pole, the broad pattern alternates between low and high pressure.
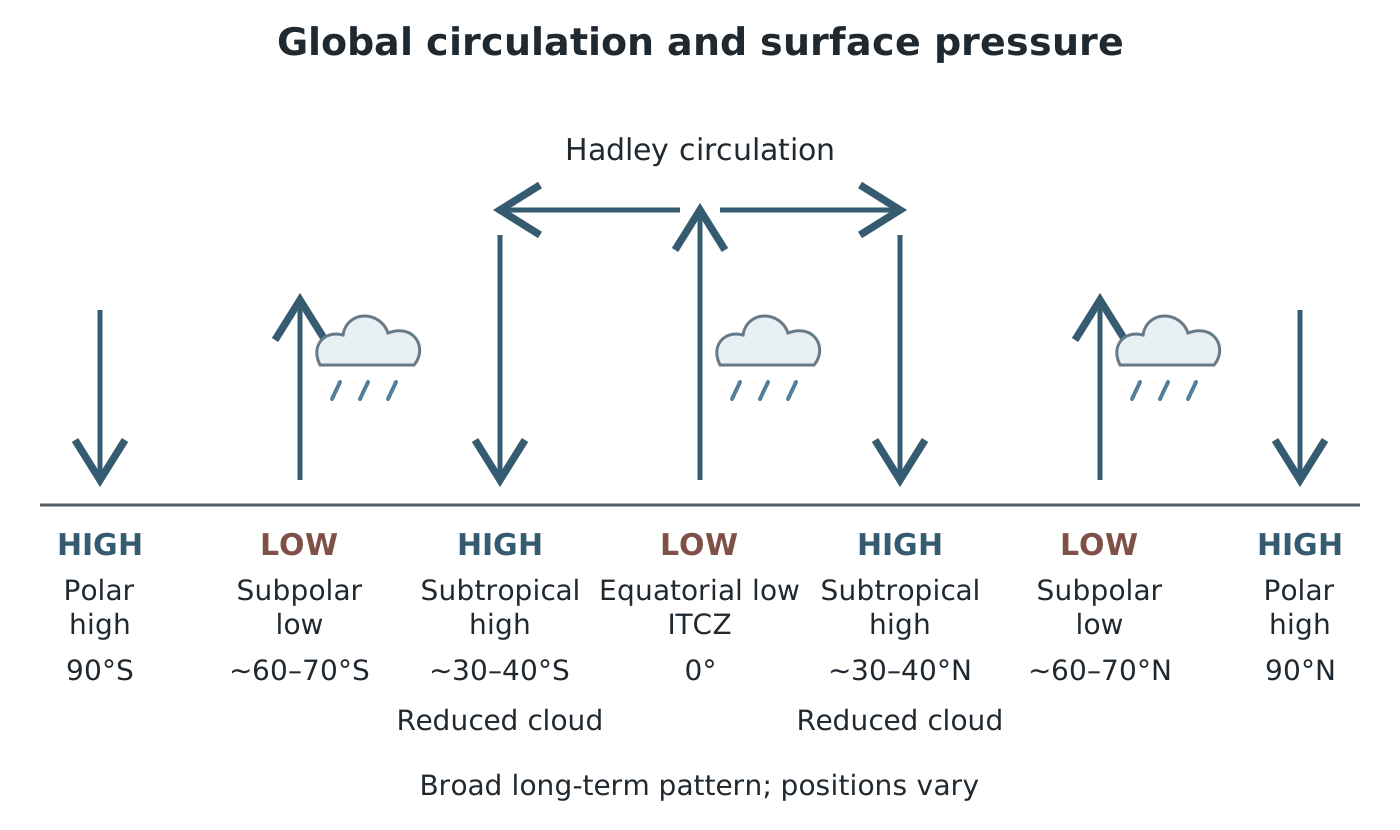
Rising and sinking branches of global circulation produce broad belts of low and high surface pressure.
These are broad, long-term patterns, not permanent rings of identical weather. Individual pressure systems move and change. The UK is affected by travelling Atlantic depressions associated with the polar-front region, so its weather can change rapidly. Fast-moving winds high in the atmosphere, called the jet stream, help steer these systems.
An anticyclone generally has sinking air, fewer clouds and light winds. In the Northern Hemisphere, winds circulate clockwise around it and spiral outwards near the surface. Earth's rotation deflects moving air, producing this curved flow rather than a direct path from high to low pressure.
In summer, high pressure often brings sunny, warm and dry weather. If it persists, temperatures can become unusually high, producing a heatwave. A prolonged shortage of rainfall can lead to drought, reducing available water. Light winds can also allow air pollution to accumulate.
In winter, the same pressure pattern can produce cold conditions. Clear skies allow substantial heat loss at night, bringing frost. Fog may develop and linger in light winds. High pressure is not always cloudless: low cloud can become established and limit daytime warming.
A persistent high can act as a block, preventing weather fronts from following their usual west-to-east path. This helps explain why dry weather can last for an extended period in one area while fronts bring prolonged wet weather elsewhere. The hazard depends on both the weather produced and how long the system remains in place.
In a depression, air converges near the surface and rises. Cooling and condensation produce clouds and often precipitation. In the Northern Hemisphere, winds circulate anticlockwise and spiral inwards near the surface.
Depressions affecting the UK often contain weather fronts: boundaries between air masses with different temperatures and moisture content. Their passage brings changing cloud, rain, wind and temperature. There may also be clearer spells between fronts; low pressure does not mean continuous rain everywhere.
Heavy or prolonged rainfall can cause flooding, while intense downpours can produce flash floods. Strong winds associated with storms can damage buildings and disrupt transport. In winter, precipitation may fall as snow if conditions are cold enough. The jet stream commonly lies farther south in winter than in summer, bringing more unsettled conditions across the UK.
Not every depression is a severe storm. Wind strength depends strongly on how rapidly pressure changes across a distance, while rainfall hazards depend on the intensity and duration of rain.
A synoptic weather chart summarises atmospheric conditions across an area at a particular time. Begin with its date, time, geographical coverage and key so that you know what it represents.
The numbered lines are isobars, joining places with equal sea-level pressure. An H marks a high-pressure centre and an L marks a low-pressure centre. Read the values towards the centre: pressure increases towards a high and decreases towards a low.
Next, examine the spacing. Closely spaced isobars mean a steep pressure gradient and generally stronger winds. Widely spaced isobars indicate a gentler gradient and lighter winds. Compare spacing over similar distances on the same chart. Pressure at a single point is not enough to establish wind strength.
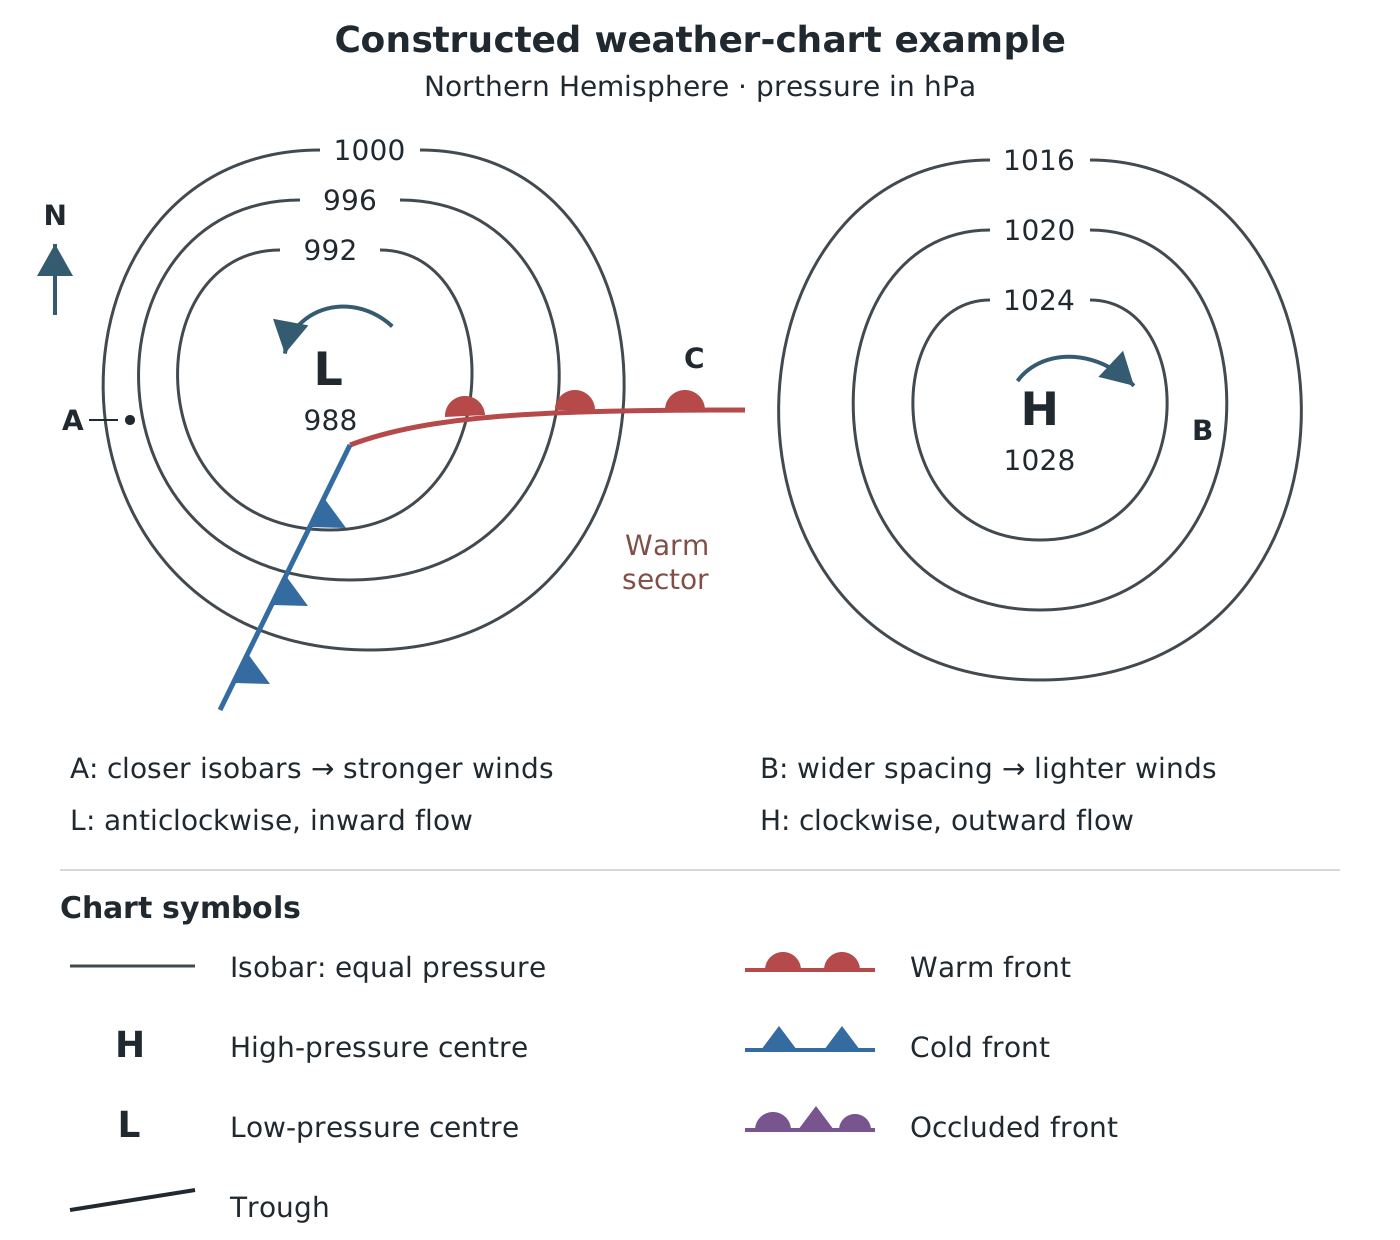
Compare isobar spacing at A and B, then use the warm-front symbols to infer the likely change at C.
Suppose the chart shows a low centred on 988 hPa, surrounded by isobars labelled 992, 996 and 1000 hPa, and a high centred on 1028 hPa, surrounded by 1024, 1020 and 1016 hPa isobars. The changing values identify the low and high even without their letters.
At A, the isobars are close together near the low, indicating stronger winds. At B, the widely spaced isobars near the high suggest lighter winds and more settled weather. This comparison uses the pressure pattern and spacing together, rather than assuming that every location near a low has equally strong winds.
Front symbols add information about air masses and movement:
The warm sector, between the warm and cold fronts of a depression, often contains low cloud and patchy light rain. Symbols remain useful when a chart is printed without colour, so read their shapes as well as their colours.
In the constructed chart, C lies just ahead of a warm front whose semicircles point towards it. Cloud and rain are likely as the front approaches, followed by warmer air after it passes. This is a reasoned forecast from the front's position and movement, not a prediction of an exact temperature or rainfall amount.
On an actual chart, apply the same sequence: locate the place, identify the pressure system, compare isobar spacing, then examine nearby fronts and their movement. A single chart is a snapshot; a sequence of charts gives better evidence of how systems are moving and how long hazardous conditions might last.
In both hemispheres:
These are broad patterns; individual systems move and change.
High pressure: sinking air, usually reduced cloud and light winds.
Low pressure: rising air cools and condenses, producing cloud and precipitation.
Explain the chain: rising air → cooling → condensation → cloud and possible precipitation. For high pressure, link sinking air to reduced cloud formation.
Use isobar spacing to compare wind strength, not just the pressure at the centre. Closely spaced isobars indicate stronger winds.
When interpreting a weather chart, support your conclusion with its features: pressure labels, isobar spacing, fronts and their direction of movement.
Clockwise circulation around highs and anticlockwise circulation around lows apply to the Northern Hemisphere; the directions reverse in the Southern Hemisphere.
High pressure does not always mean hot weather. Its effects depend on the season, and winter anticyclones can bring frost and fog.
It can see this note and what your specification asks for.
Answers are free with an account.
1 free note left this week
Get more free notesYour answer sets when this note comes back for review, or marks it complete.
Was this note helpful?
Log in to tell us whether it helped, or to report a problem.
Last updated
Atmospheric pressure
The force exerted by the atmosphere per unit area of a surface, measured in hectopascals (hPa) or millibars.
Anticyclone
An area with higher atmospheric pressure than its surroundings, generally associated with sinking air and settled weather.
Depression
An area with lower atmospheric pressure than its surroundings, associated with rising air and often unsettled weather.
Isobar
A line on a weather chart joining places with equal atmospheric pressure, usually adjusted to sea level.
Pressure gradient
The change in atmospheric pressure over a distance. A steeper pressure gradient generally produces stronger winds.
Synoptic weather chart
A map summarising atmospheric conditions across an area at a particular time, using features such as isobars, pressure centres and fronts.
Weather front
A boundary between air masses with different characteristics, such as temperature and moisture content.
Occluded front
A front formed when a cold front overtakes a warm front.
Intertropical Convergence Zone (ITCZ)
A band of low pressure near the equator where trade winds converge and air rises, producing frequent thunderstorms and heavy rain.
Blocking
A persistent pressure pattern in which high pressure obstructs the usual movement of weather systems, potentially prolonging dry weather in some areas and wet weather in others.
Put your knowledge into practice — try past paper questions for Geography B
Atmospheric pressure
The force exerted by the atmosphere per unit area of a surface, measured in hectopascals (hPa) or millibars.
Anticyclone
An area with higher atmospheric pressure than its surroundings, generally associated with sinking air and settled weather.
Depression
An area with lower atmospheric pressure than its surroundings, associated with rising air and often unsettled weather.
Isobar
A line on a weather chart joining places with equal atmospheric pressure, usually adjusted to sea level.
Pressure gradient
The change in atmospheric pressure over a distance. A steeper pressure gradient generally produces stronger winds.
Synoptic weather chart
A map summarising atmospheric conditions across an area at a particular time, using features such as isobars, pressure centres and fronts.
Weather front
A boundary between air masses with different characteristics, such as temperature and moisture content.
Occluded front
A front formed when a cold front overtakes a warm front.
Intertropical Convergence Zone (ITCZ)
A band of low pressure near the equator where trade winds converge and air rises, producing frequent thunderstorms and heavy rain.
Blocking
A persistent pressure pattern in which high pressure obstructs the usual movement of weather systems, potentially prolonging dry weather in some areas and wet weather in others.
Northern Hemisphere: clockwise around highs; anticlockwise around lows. Directions reverse in the Southern Hemisphere.
Front symbols: warm = semicircles; cold = triangles; occluded = alternating semicircles and triangles on the same side. Symbols point towards movement. A trough has no front symbols and often indicates showers.