Loading…


Loading…
Loading…
Loading…
Edexcel GCSE Combined Science · 1SC0
Edexcel 1SC0 · Distance, velocity, and acceleration Check the specification (PDF) (opens in a new tab)
Speed describes how quickly an object covers distance. A speed of 3 m/s means that an object travelling steadily covers 3 metres every second. Speed does not tell us the direction of travel.
An object may speed up, slow down or stop during a journey. Its average speed describes the journey as a whole:
Using for average speed, for distance travelled and for time:
Distance is measured in metres (m), time in seconds (s) and speed in metres per second (m/s). The total time includes any stops: stopping does not add distance, but it does add time and therefore reduces the average speed.
For example, suppose a cyclist travels 600 m in 120 s. Their average speed is . This does not mean they travelled at exactly 5 m/s throughout; it means they covered an average of 5 metres for each second of the whole journey.
Rearranging the speed equation gives:
So distance travelled equals average speed multiplied by time. For example, an object travelling at an average speed of 4 m/s for 30 s covers .
The units must match the equation. Convert kilometres to metres by multiplying by 1000, minutes to seconds by multiplying by 60, and hours to seconds by multiplying by 3600. A journey of 1.5 km completed in 50 s therefore has an average speed of .
A distance–time graph places time on the horizontal axis and distance on the vertical axis. The following graph shows the total distance travelled by an object during a journey.
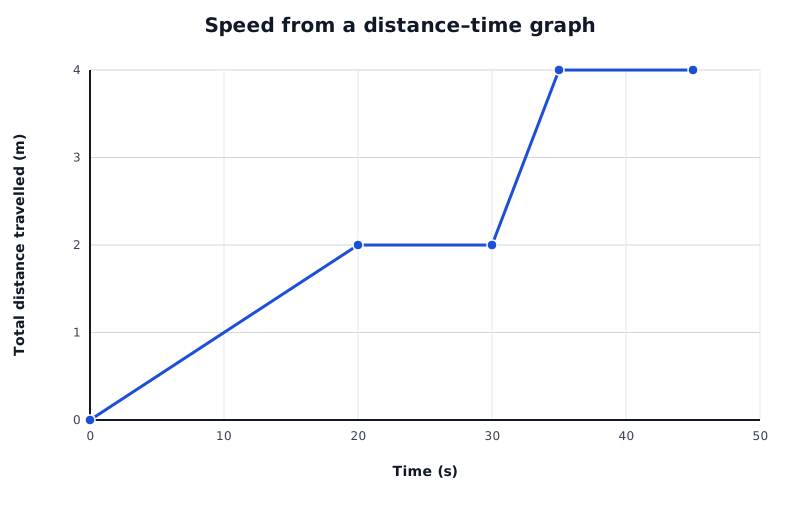
A journey: rising straight sections show constant speed; horizontal sections show stops.
Data for Speed from a distance–time graph
| Series | Time (s) | Total distance travelled (m) |
|---|---|---|
| Total distance travelled | 0 | 0 |
| Total distance travelled | 20 | 2 |
| Total distance travelled | 30 | 2 |
| Total distance travelled | 35 | 4 |
| Total distance travelled | 45 | 4 |
From 0 to 20 s, the object covers 2 m. The line is straight and rising, so the object moves at a constant speed. From 20 to 30 s, the line is horizontal: time passes but the distance travelled stays at 2 m, so the object is stationary.
From 30 to 35 s, the object covers another 2 m. This section is steeper than the first, showing that the object travels faster. From 35 to 45 s, it is stationary again.
The important feature is the gradient, or steepness, rather than the height of the line. A point high on the graph shows that a large distance has already been travelled; it does not necessarily show a high speed.
The gradient compares the increase in distance with the time taken for that increase:
Choose two points on the same straight section. Read their coordinates, subtract the distance values and subtract the time values. A gradient triangle makes these two changes easier to see.
For the section from 30 to 35 s in the graph:
The first section has a speed of , so the steeper section represents a speed four times as large. A horizontal section has zero gradient and therefore zero speed.
A curved rising line represents changing speed. If the curve becomes steeper, the object is speeding up. If it becomes shallower, the object is slowing down. There is no single constant gradient for the whole curve.
Every speed measurement needs a distance and a corresponding time. To measure a trolley’s average speed, mark two positions along its track and measure the distance between them with a metre rule. Start a stopwatch when the trolley passes the first mark and stop it when it passes the second. Divide the measured distance by the measured time.
This method is simple, but the person operating the stopwatch takes time to react at each mark. Reaction time makes manual timing especially unsuitable for very short journeys. Repeating measurements helps reveal variation between trials, although repetition does not remove reaction-time error.
Choose equipment to suit the distance: a metre rule is suitable for a short laboratory track, whereas a tape measure or trundle wheel is more suitable for a long route.
A light gate contains a light beam and a detector. A flag attached to a moving trolley interrupts the beam as it passes. Electronic timing avoids the human reaction time involved in starting and stopping a stopwatch.
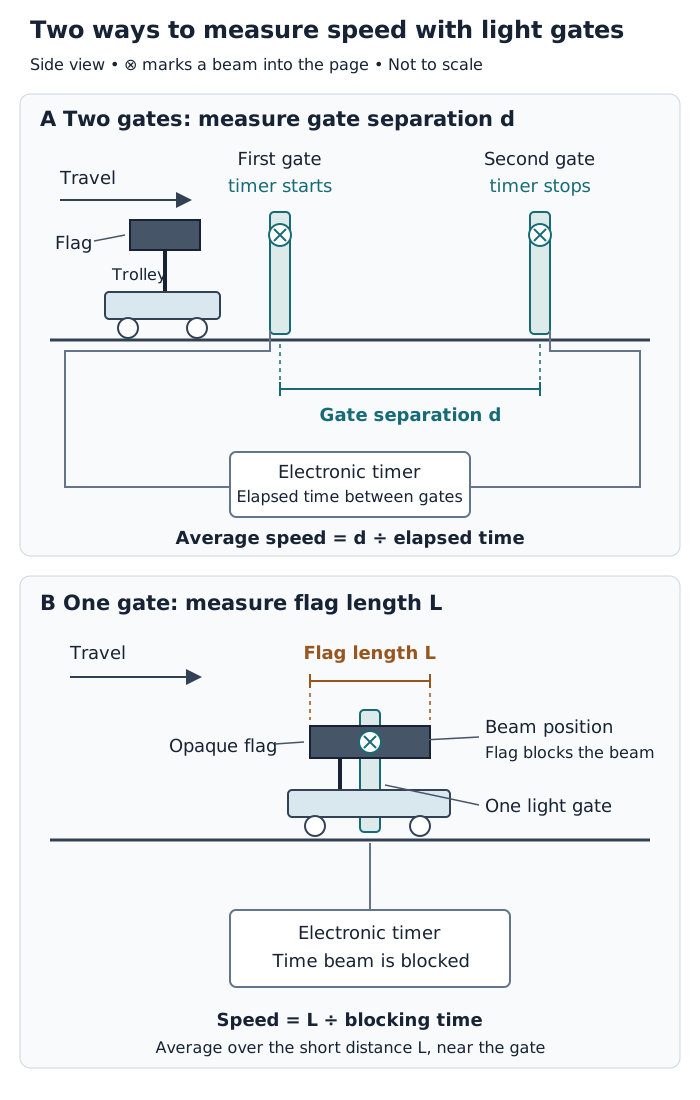
Two gates time travel between positions; one gate times the passage of a flag of known length.
Two light gates measure the time for a journey between two positions. Measure the separation of the gates along the track. Configure the timer to start when the flag interrupts the first gate and stop when it interrupts the second. The average speed between the gates is their separation divided by this time.
One light gate measures how long its beam is blocked. Measure the length of the flag in the direction of travel. As the flag passes through the beam, the trolley travels this distance during the blocking time. Its speed is therefore the flag length divided by the blocking time. This gives an average over a short distance, representing the speed near the gate.
A motion sensor offers another method. Connected to a data logger or computer, it records the object’s position at successive times. The changes in distance and time can be used to calculate speed and produce a distance–time graph.
Typical speeds are useful benchmarks, not exact values for every person or journey.
| Example | Approximate speed (m/s) |
|---|---|
| Walking | 1.3 |
| Running | 3.6 |
| Cycling | 5.4 |
| Gentle breeze | 4 |
| Car travelling on a motorway | 31 |
| Express train | 58 |
| Passenger aircraft cruising | 245 |
| Sound in air | 330 |
Walking is often rounded to about 1.5 m/s. Walking, running and cycling speeds depend on factors such as fitness, age, terrain and journey length. Transport speeds depend on the vehicle and conditions, while wind speed varies greatly with the weather. The speed of sound also depends on the medium: the value above is for air, not every material.
Get unlimited access to all revision notes, key terms, and exam tips.
Average speed = total distance ÷ total time, including stops.
Use metres, seconds and m/s. Convert km × 1000; minutes × 60; hours × 3600.
Electronic timing avoids stopwatch reaction-time error.
Walking ≈ 1.3–1.5; running ≈ 3.6; cycling ≈ 5.4; gentle breeze ≈ 4; motorway car ≈ 31; express train ≈ 58; cruising passenger aircraft ≈ 245; sound in air ≈ 330.
Get unlimited access to all revision notes, key terms, and exam tips.
Convert distances to metres and times to seconds before calculating a speed in m/s.
For a graph gradient, use changes in distance and time between two points, not simply one point’s coordinates. Choose widely separated points on the same straight section.
Check the axis labels: the gradient of a distance–time graph gives speed, not acceleration.
In a practical description, state which distance and time you measure and how you use them to calculate speed.
With one light gate, use the flag length; with two light gates, use the distance between the gates.
Speed
The rate at which an object travels distance, measured in metres per second (m/s).
Average speed
The total distance travelled divided by the total time taken, including any stops.
Gradient
The steepness of a graph line, calculated as the change in the vertical-axis quantity divided by the change in the horizontal-axis quantity.
Distance–time graph
A graph showing how distance changes with time. Its gradient gives speed.
Light gate
A device that detects when an object interrupts a light beam, allowing its motion to be timed electronically.
Put your knowledge into practice — try past paper questions for Combined Science
Speed
The rate at which an object travels distance, measured in metres per second (m/s).
Average speed
The total distance travelled divided by the total time taken, including any stops.
Gradient
The steepness of a graph line, calculated as the change in the vertical-axis quantity divided by the change in the horizontal-axis quantity.
Distance–time graph
A graph showing how distance changes with time. Its gradient gives speed.
Light gate
A device that detects when an object interrupts a light beam, allowing its motion to be timed electronically.