

Loading…
Loading…
Loading…
AQA GCSE Psychology · 8182
AQA 8182 · Data Analysis Skills Check the specification (PDF) (opens in a new tab)
A researcher might collect the number of words each participant recalls in a memory task. A list of individual scores contains useful detail, but it can be difficult to see the overall pattern. Descriptive statistics summarise features of the data.
Two features matter here: a typical score and how spread out the scores are. The mean, median and mode are measures of central tendency: different ways of identifying the centre or typical value. The range is a measure of dispersion, which means spread. Using both helps a researcher describe results more clearly than using an average alone.
The mean is the arithmetic average. Add all the scores, then divide by the number of scores:
Suppose four participants recall 4, 6, 7 and 9 words. Their total is words. Dividing by four gives a mean of words. Think of this as sharing their total equally between the four participants. Nobody needs to have recalled exactly 6.5 words for this to be a meaningful average.
The mean uses every score, so a change in any score changes the mean. This is useful, but it also makes the mean sensitive to outliers: unusually high or low scores. If most participants have similar scores but one has a very high score, the mean is pulled upwards and may describe the typical participant poorly.
The median is the middle score after the data have been arranged in numerical order. It depends on position rather than adding every score.
For an odd number of scores, there is one middle value. Suppose five participants recall 9, 4, 7, 6 and 7 words. In order, these are 4, 6, 7, 7, 9. Two scores lie on each side of the middle score, so the median is 7 words.
For an even number of scores, there are two middle values. Find their mean. For 4, 6, 7, 9, the middle values are 6 and 7, so the median is words.
The median is less affected by extreme scores than the mean. In 4, 6, 7, 7, 20, the median is still 7 words, whereas the mean is words. Here, the median better represents the cluster of lower scores. Its limitation is that it does not use the actual size of every score.
The mode is the most frequently occurring score or category. In 4, 6, 7, 7, 9, the mode is 7 words, because 7 occurs twice and every other score occurs once.
The mode can also summarise categories. Suppose participants report their preferred revision method as flashcards, reading, flashcards, practice questions and flashcards. The modal category is flashcards. A mean cannot meaningfully be calculated from these category names.
A dataset can have two or more modes when values tie for the highest frequency. If every value occurs equally often, there is no single most frequent value. The mode is simple to identify, but it does not take every score's numerical value into account and may give a limited picture of the results.
The range is the difference between the highest and lowest scores:
For memory scores of 4, 6, 7, 7, 9 words, the range is words. A larger range means the scores extend across a wider interval; a smaller range means the highest and lowest scores are closer together.
The range adds information that an average misses. Suppose one group scores 5, 6, 7 words and another scores 2, 6, 10 words. Both means are 6 words, but their ranges are 2 words and 8 words respectively. The second group's scores are more spread out.
The range is quick to calculate, but uses only the two extreme scores. One outlier can greatly increase it, and it tells us nothing about how scores are distributed between the lowest and highest values.
A distribution describes how scores are spread across possible values. A normal distribution has a symmetrical, bell-shaped curve. Most scores cluster around the centre, and progressively fewer occur towards either extreme.
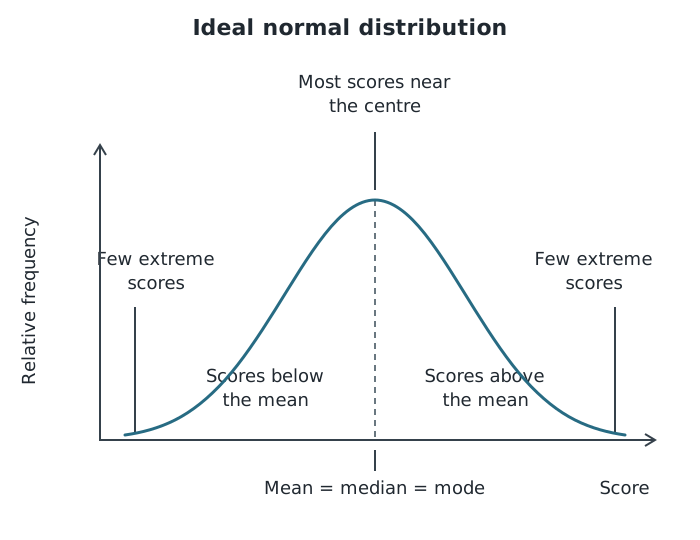
An ideal normal distribution: scores cluster around the centre, with fewer scores towards either extreme.
Read the horizontal axis as the score and the vertical axis as how common scores are. The highest point shows the most common score. The matching shape on either side of the centre shows symmetry: equally distant scores below and above the centre are equally common.
In a perfect normal distribution, the mean, median and mode are equal and lie at the centre. Scores to the left are below the mean; scores to the right are above it. Half the distribution lies on each side. The tails of the ideal curve approach the horizontal axis without touching it: very extreme values are increasingly uncommon.
Real research results may only approximate this shape. Do not assume that every psychological dataset is normally distributed; examine the pattern of scores as well as its numerical summaries.
Significant figures express the precision with which a number is written. Count from the first non-zero digit. For example, 6.50 has three significant figures: its final zero communicates precision. 0.0065 has two significant figures: the zeros before 6 only locate the decimal point.
To round to a chosen number of significant figures, find the last digit to keep and inspect the next digit. If the next digit is 5 or more, round up; if it is below 5, leave the retained digit unchanged. Remove the remaining digits, keeping any zeros needed to preserve place value.
For example, 6.478 becomes 6.5 to two significant figures and 6.48 to three significant figures. 14,489 becomes 14,000 to two significant figures: the first two significant digits are 1 and 4, and the next digit is 4.
Significant figures are not the same as decimal places. Decimal places count digits after the decimal point; significant figures start at the first non-zero digit, wherever it occurs.
Choose a sensible precision for statistical results. Follow a stated instruction; otherwise consider the precision of the original measurements and avoid reporting a long calculator display as though every digit were meaningful. Keep full precision while calculating, then round the final result.
Put scores in numerical order before finding the median. With an even number of scores, calculate the mean of the two middle scores.
The mode is the most frequent score or category, not the number of times it occurs.
Calculate the range as highest score minus lowest score; do not add 1.
Round directly from the original value to the requested number of significant figures, rather than rounding in stages.
Keep unrounded values during a calculation and round the final answer. Follow any accuracy instruction in the question.
Equal mean, median and mode are a characteristic of a normal distribution, but these values alone do not prove that a dataset is normally distributed.
It can see this note and what your specification asks for.
Answers are free with an account.
1 free note left this week
Get more free notesYour answer sets when this note comes back for review, or marks it complete.
Was this note helpful?
Log in to tell us whether it helped, or to report a problem.
Last updated
Descriptive statistic
A numerical summary describing a feature of a dataset, such as its typical score or its spread.
Central tendency
The centre or typical value of a dataset, summarised using a measure such as the mean, median or mode.
Mean
The arithmetic average: the total of all scores divided by the number of scores.
Median
The middle score when values are arranged in numerical order. If there are two middle scores, their mean is the median.
Mode
The score or category that occurs most frequently in a dataset.
Dispersion
The extent to which values in a dataset are spread out.
Range
A measure of dispersion calculated by subtracting the lowest score from the highest score.
Outlier
A score unusually far from the other scores in a dataset.
Normal distribution
A symmetrical, bell-shaped distribution in which most scores cluster around the centre and the mean, median and mode are equal.
Significant figure
A digit counted when expressing the precision of a number. Significant figures are counted from the first non-zero digit.
Put your knowledge into practice — try past paper questions for Psychology
Descriptive statistic
A numerical summary describing a feature of a dataset, such as its typical score or its spread.
Central tendency
The centre or typical value of a dataset, summarised using a measure such as the mean, median or mode.
Mean
The arithmetic average: the total of all scores divided by the number of scores.
Median
The middle score when values are arranged in numerical order. If there are two middle scores, their mean is the median.
Mode
The score or category that occurs most frequently in a dataset.
Dispersion
The extent to which values in a dataset are spread out.
Range
A measure of dispersion calculated by subtracting the lowest score from the highest score.
Outlier
A score unusually far from the other scores in a dataset.
Normal distribution
A symmetrical, bell-shaped distribution in which most scores cluster around the centre and the mean, median and mode are equal.
Significant figure
A digit counted when expressing the precision of a number. Significant figures are counted from the first non-zero digit.
A larger range indicates a wider spread. The range uses only the extremes, is sensitive to outliers and does not describe the scores between them.
Count from the first non-zero digit. Inspect the next digit: 0–4, leave; 5–9, round up. Leading zeros do not count; a trailing decimal zero can show precision.
Use the requested precision or one appropriate to the measurements. Significant figures are not decimal places.