

Loading…
Loading…
Loading…
AQA GCSE Psychology · 8182
AQA 8182 · Data Analysis Skills Check the specification (PDF) (opens in a new tab)
Psychologists often collect many numerical results, such as recall scores or reaction times. A table organises those results; a graph makes their pattern easier to see. Choosing a display depends on what you want to show: how often scores occur, differences between categories, or a relationship between two variables.
Always begin by identifying what each number measures. A recall score is a count of words, whereas a reaction time is a measurement on a continuous scale. This difference affects how the results should be displayed.
A frequency is the number of times a value or category occurs. To construct a frequency table, list the possible values or categories, tally each observation in the appropriate row, then count the tallies. Include values with a frequency of zero when they belong within the range being displayed.
Suppose ten participants recall these numbers of words: 0, 1, 1, 2, 2, 2, 3, 3, 4 and 4. Their results can be organised as follows:
| Words recalled | Frequency |
|---|---|
| 0 | 1 |
| 1 | 2 |
| 2 | 3 |
| 3 | 2 |
| 4 | 2 |
| Total | 10 |
The row for two words means that three participants each recalled two words. It does not mean that two participants recalled three words. Adding the frequencies gives ten, so every participant has been counted once.
A frequency table preserves how often each score occurs, but not which participant obtained it. It also provides the numbers needed to draw a frequency diagram.
A bar chart compares separate categories or discrete values. The bars have equal widths and gaps between them, because the horizontal positions do not form continuous intervals.
For the recall table, put words recalled on the horizontal axis and frequency on the vertical axis. Draw bars with heights 1, 2, 3, 2 and 2 above the scores 0 to 4. This is a frequency diagram: the height of each bar shows how many participants obtained that score.
Bar charts can also compare categories. Suppose six participants prefer studying in silence and four prefer studying with music. Two separated bars, labelled Silence and Music, would show frequencies of six and four.
The vertical axis need not always show frequency. A chart comparing mean recall in two experimental conditions would instead show mean words recalled. Read the axis label before deciding what a bar means.
A histogram displays continuous measurements grouped into intervals. Reaction time is continuous: a participant could respond in 0.42 seconds, 0.425 seconds or another value within the range. Rather than drawing a bar for every possible time, group the measurements.
For example, suppose ten reaction times are summarised like this:
| Reaction time, t (s) | Frequency |
|---|---|
| 2 | |
| 5 | |
The interval notation prevents overlap: a time of exactly 0.4 seconds belongs in the second interval, not the first. Each observation must belong in just one interval.
Put reaction time on the horizontal axis, with boundaries at 0.2, 0.4, 0.6 and 0.8 seconds. Because these intervals have equal widths, the bar heights can show frequencies of two, five and three. The bars touch because the intervals join along a continuous scale. In a histogram, bar area represents frequency; with equal-width intervals, taller bars also represent larger frequencies.
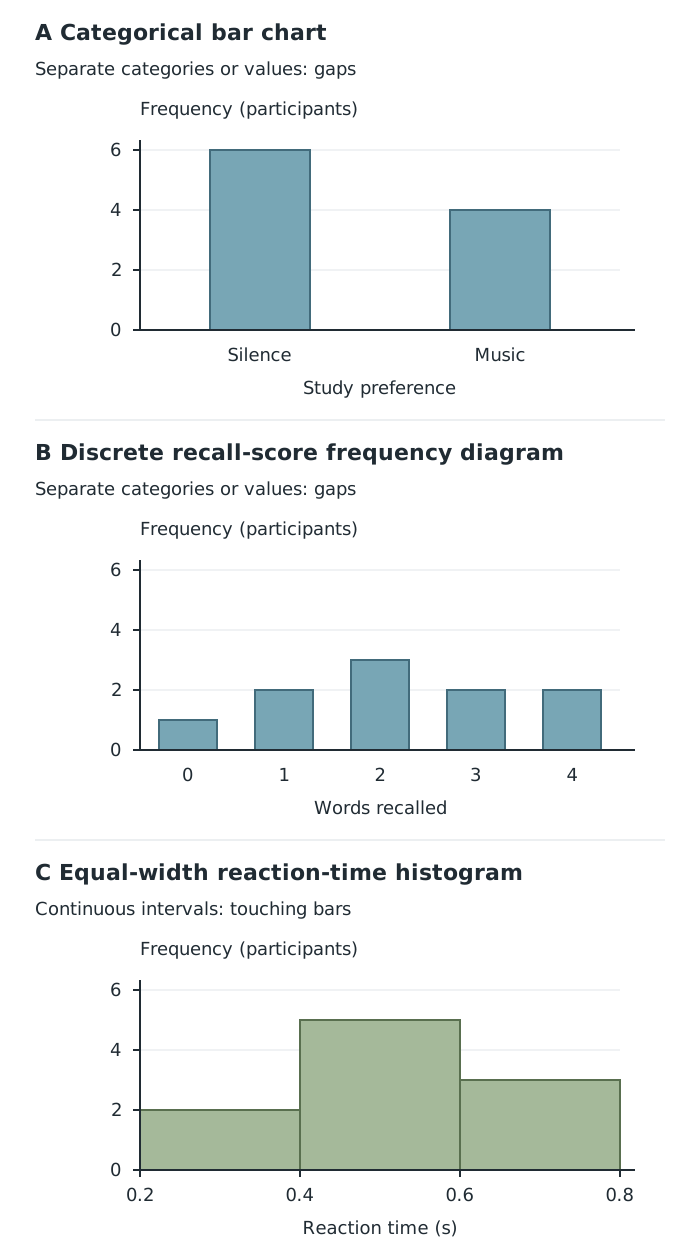
Separate categories and discrete scores have gaps between bars; continuous intervals have touching bars.
The middle reaction-time interval contains five participants, compared with two in the first interval. However, the grouped table and histogram cannot tell you the exact times of those five participants. Changing from raw numbers to grouped data makes the pattern clearer but loses some detail.
A scatter diagram shows whether two variables are related. Each point represents a pair of measurements from the same participant or observation. It does not show frequencies as bar heights.
Suppose six participants report their hours of sleep and complete a recall task:
| Participant | Sleep (hours) | Words recalled |
|---|---|---|
| A | 4 | 4 |
| B | 5 | 6 |
| C | 6 | 5 |
| D | 6 | 7 |
| E | 7 | 8 |
| F | 8 | 9 |
To plot these results, label the horizontal axis Sleep and the vertical axis Words recalled. Choose evenly spaced scales covering all the values. Participant B becomes the point : move across to five hours, then up to six words. Participants C and D have the same horizontal position but different vertical positions. Plot all six points without joining them together.
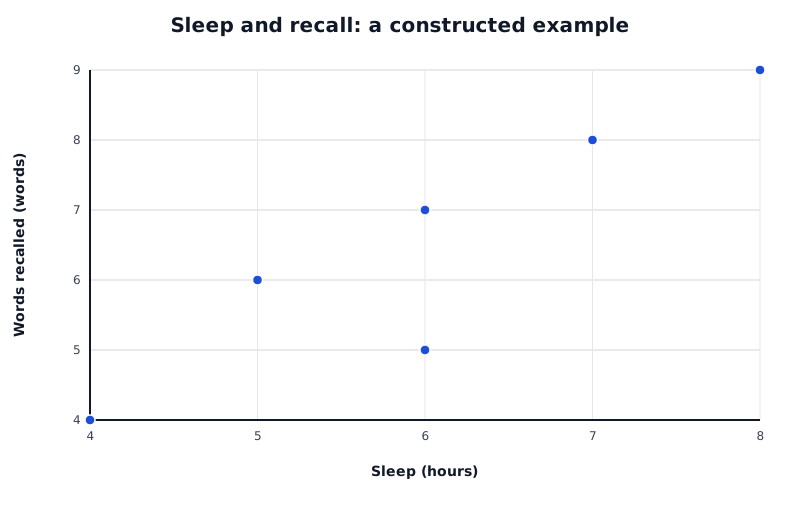
Each point represents one participant’s paired measurements. The overall upward pattern shows a positive correlation.
Data for Sleep and recall: a constructed example
| Series | Sleep (hours) | Words recalled (words) |
|---|---|---|
| Participants | 4 | 4 |
| Participants | 5 | 6 |
| Participants | 6 | 5 |
| Participants | 6 | 7 |
| Participants | 7 | 8 |
| Participants | 8 | 9 |
These points rise overall from bottom-left to top-right. This indicates a positive correlation: participants reporting more sleep tend to recall more words. It is a tendency, not a rule applying perfectly to every pair of participants.
A positive correlation rises from bottom-left to top-right. A negative correlation falls from top-left to bottom-right: as one variable increases, the other tends to decrease. With no correlation, the points show no clear upward or downward pattern.
Strength concerns how closely the points follow the overall pattern. Points clustered closely around a straight-line pattern show a stronger correlation than widely scattered points. A steep slope does not itself mean a strong correlation.
Correlation alone cannot establish cause and effect. In the sleep example, another factor could influence both sleep and recall. The graph therefore supports an association, not the conclusion that extra sleep caused better recall.
When plotting experimental results, usually place the independent variable—the variable the researcher changes—on the horizontal axis, and the dependent variable—the outcome measured—on the vertical axis. For example, a numerical presentation time could be plotted against the number of words recalled. If the independent variable consists of separate conditions, such as silence and music, a bar chart is more suitable.
To interpret any graph, read its title, axes, units and scale first. Describe the main pattern in terms of the actual variables, then support it with values. To translate a plotted point back into numbers, read its horizontal and vertical coordinates and record them together in a table. This reverses the plotting process while preserving the paired measurements.
Check what the vertical axis represents: frequency, a score or a mean. A taller bar does not always mean more participants.
Label axes with the variables and any units, and use evenly spaced numerical scales.
Keep gaps between bars for separate categories or discrete values; histogram bars touch.
Keep each participant’s two measurements paired when drawing a scatter diagram. Do not sort the two columns separately.
Describe a correlation in context, giving its direction and strength. Do not claim that correlation proves cause and effect.
Support interpretations with values read from the display, and check that table frequencies add up to the total number of observations.
It can see this note and what your specification asks for.
Answers are free with an account.
1 free note left this week
Get more free notesYour answer sets when this note comes back for review, or marks it complete.
Was this note helpful?
Log in to tell us whether it helped, or to report a problem.
Last updated
Frequency
The number of times a value or category occurs in a dataset.
Frequency table
A table showing each value, category or interval alongside the number of observations it contains.
Frequency diagram
A graphical display showing how often values or groups of values occur.
Bar chart
A chart with separated bars representing distinct categories or discrete values. Each bar’s height shows the quantity labelled on the vertical axis.
Histogram
A graph showing continuous numerical data grouped into intervals, with touching bars whose areas represent frequencies.
Continuous data
Numerical data that can take any value within a range, such as reaction time.
Discrete data
Numerical data consisting of separate possible values, such as the number of words recalled.
Scatter diagram
A graph plotting paired measurements of two variables, with one point for each participant or observation.
Correlation
An association between two variables: their values vary together in a recognisable pattern.
Positive correlation
An association in which higher values of one variable tend to occur with higher values of the other.
Negative correlation
An association in which higher values of one variable tend to occur with lower values of the other.
Put your knowledge into practice — try past paper questions for Psychology
Frequency
The number of times a value or category occurs in a dataset.
Frequency table
A table showing each value, category or interval alongside the number of observations it contains.
Frequency diagram
A graphical display showing how often values or groups of values occur.
Bar chart
A chart with separated bars representing distinct categories or discrete values. Each bar’s height shows the quantity labelled on the vertical axis.
Histogram
A graph showing continuous numerical data grouped into intervals, with touching bars whose areas represent frequencies.
Continuous data
Numerical data that can take any value within a range, such as reaction time.
Discrete data
Numerical data consisting of separate possible values, such as the number of words recalled.
Scatter diagram
A graph plotting paired measurements of two variables, with one point for each participant or observation.
Correlation
An association between two variables: their values vary together in a recognisable pattern.
Positive correlation
An association in which higher values of one variable tend to occur with higher values of the other.
Negative correlation
An association in which higher values of one variable tend to occur with lower values of the other.
| 3 |
Label headings or axes, include units and use even numerical scales. Check that frequencies total the number of observations. Keep paired measurements together and do not join scatter points.
For experimental graphs, usually plot the independent variable horizontally and the dependent variable vertically. Read coordinates or bar heights to convert a graph back into numerical information. Grouped data cannot recover exact individual measurements.
Describe the pattern in context and support it with values. Correlation does not prove causation.