

Loading…
Loading…
Loading…
AQA GCSE Combined Science: Synergy · 8465
AQA 8465 · 4.7.1.6 Newton's Second Law Check the specification (PDF) (opens in a new tab)
Acceleration describes how quickly an object's velocity changes. This investigation tests two predictions from Newton's Second Law, : increasing the resultant force should increase acceleration if mass is constant, while increasing mass should decrease acceleration if the resultant force is constant.
A trolley pulled by a falling weight allows these two effects to be investigated separately. You measure its motion, calculate its acceleration and compare runs in which only one factor is deliberately changed.
The apparatus consists of a toy car or trolley, a metre ruler, pencil, chalk or masking tape, a bench pulley, string, a small weight stack or mass hanger with slotted masses, a stopwatch and Blu-tac. Additional masses are needed for the mass investigation.
Mark a start line and lines at 20, 40, 60, 80 and 100 cm along the bench. Secure the pulley at the end of the bench. Tie the string to the trolley, pass it over the pulley and attach the hanging weight stack. The string between the trolley and pulley should be horizontal and in line with the trolley, so that it pulls straight along the bench.
The falling weight drives the motion of both the trolley and the hanging masses. Friction in the wheels and pulley opposes the motion, so the hanging weight is not exactly the resultant force accelerating the system. Keeping friction small and the setup unchanged makes comparisons more useful.
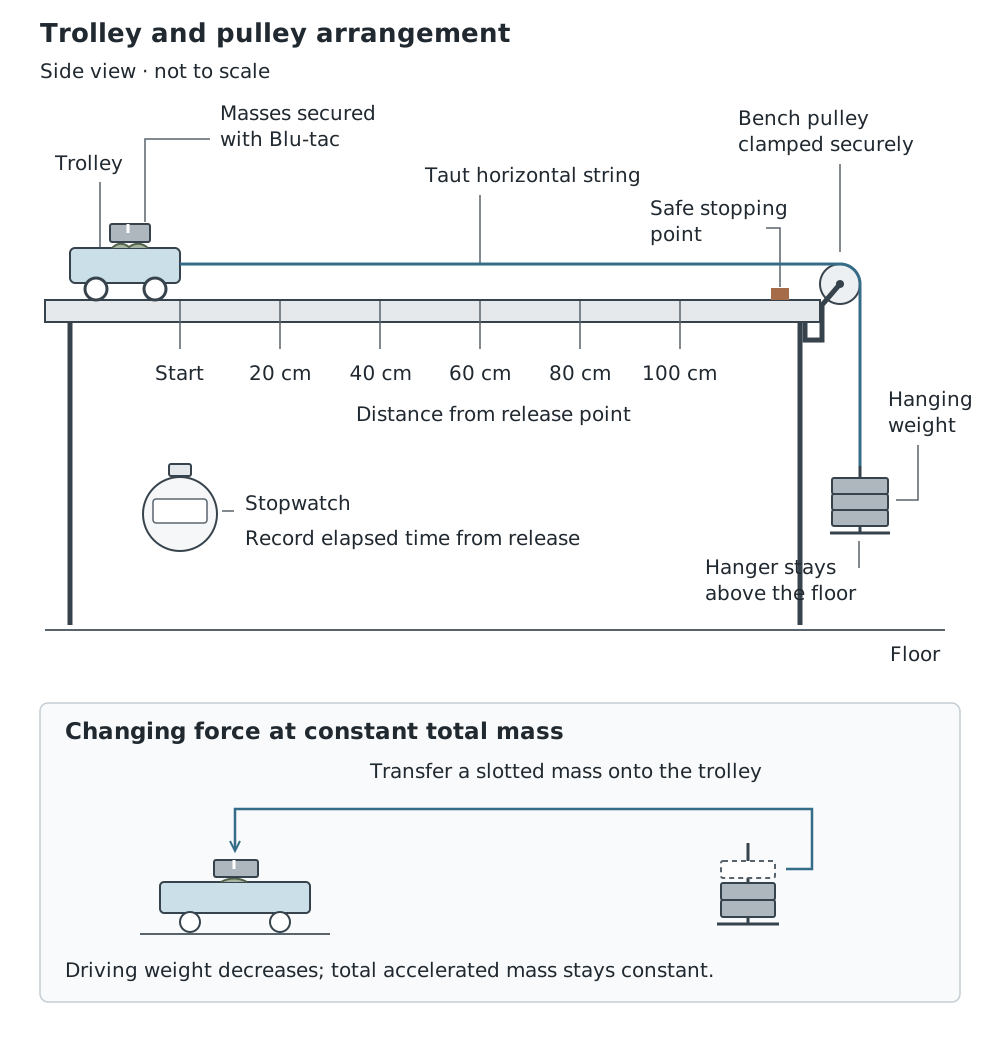
The falling weight pulls the trolley. Moving masses from the hanger to the trolley changes the driving force without changing the total accelerated mass.
Secure the pulley and any masses on the trolley before starting. Keep feet clear of the hanging masses, and arrange a safe way to stop the trolley before it reaches the pulley or bench edge. The hanging masses must remain above the floor throughout the timed distance: once they land, they no longer provide the same pull.
The independent variable is the driving force supplied by the hanging weight. The dependent variable is the trolley's acceleration. Keep the total accelerated mass, marked distances, starting position and bench setup constant.
When reducing the hanging weight, transfer the removed masses onto the trolley, securing them with Blu-tac. This keeps the total mass of the trolley, hanger and masses constant. Simply removing masses from the apparatus would change both force and total mass, so it would not isolate the effect of force.
A results table can have distance rows of 20, 40, 60, 80 and 100 cm, with separate time-in-seconds columns for each hanging weight. Record repeat runs clearly rather than overwriting earlier readings.
Now the independent variable is mass and the dependent variable is acceleration. Keep the hanging weight constant, along with the distances, release method and bench setup.
Use the first investigation to choose a hanging weight that gently accelerates the trolley. Put a 200 g mass on the trolley and secure it. Release the trolley from the same start line, record lap times at the same marks and repeat the run.
Increase the mass on the trolley and repeat the measurements, without changing the hanging weight. For example, the added mass could increase to 400 g, 600 g, 800 g and 1000 g. Keep the load balanced so that the trolley travels straight.
Record the added mass separately from the total mass. The total accelerated mass includes the trolley, the masses on it and the hanging masses; it is not just the mass added to the trolley. A table can retain the same distance rows, with time columns for each mass setting.
The stopwatch readings are elapsed times from release, not the times for individual intervals. Subtract consecutive readings to find each interval time, then calculate its average speed:
Each interval is 20 cm, or 0.20 m. Suppose the trolley reaches 40 cm at 1.20 s and 60 cm at 1.50 s. It takes to cover that interval, giving an average speed of .
For approximately uniform acceleration, an interval's average speed represents the speed at its middle time. In this example, that time is after release.
Calculate the speeds for the first and last intervals and use their middle times to estimate acceleration:
Because the trolley moves in one direction, its change in speed gives its change in velocity here. Repeat this calculation for every force or mass setting. A shorter journey time alone is not an acceleration measurement: the changing speeds show how rapidly the trolley accelerates.
At constant total mass, a larger driving force should give a larger acceleration. For a constant mass and negligible friction, : doubling the resultant force doubles acceleration. An acceleration–force graph should therefore be a straight line through the origin under these ideal conditions.
At constant force, increasing total mass should reduce acceleration. The relationship is inverse, : doubling the total mass halves acceleration. An acceleration–mass graph is a decreasing curve; plotting acceleration against instead should give a straight line under ideal conditions.
Compare these predictions with your calculated accelerations. Real results may depart from the ideal relationships because of friction and measurement errors, particularly when the hanging weight is small.
Manual timing is a major limitation. Reaction time varies when starting the stopwatch and recording laps, producing random error. Repeated runs and mean readings reduce its influence. Light gates linked to a data logger can improve timing by removing the need to press a button as the trolley passes each mark.
A consistently sloping bench or a ruler with an incorrectly positioned zero can introduce systematic error. Check the bench and distance markings before taking readings. Repeating the same faulty setup does not remove such an error.
Release the trolley without a push each time, keep the string taut and use the same point on the trolley to judge when it crosses a line. Choose weights that allow motion slow enough to time reliably. Record the masses, distances, apparatus and release procedure clearly so that another group can repeat the investigation and compare results.
Trolley → horizontal string → bench pulley → hanging weight. Mark 20, 40, 60, 80 and 100 cm. Release from rest without pushing; record elapsed lap times, repeat and calculate means.
Subtract consecutive lap readings to obtain interval times.
For each investigation, identify what you change, what you measure and what you keep constant.
When varying the hanging weight, transfer removed masses to the trolley so that the total accelerated mass stays constant.
Lap readings are times from release. Subtract consecutive readings to find the time taken for each 20 cm interval.
Use total mass, not just added mass, when analysing the mass investigation. Convert grams to kilograms.
Link each improvement to a specific problem: repeated readings reduce random timing error; electronic timing reduces the effect of human reaction time.
It can see this note and what your specification asks for.
Answers are free with an account.
1 free note left this week
Get more free notesYour answer sets when this note comes back for review, or marks it complete.
Was this note helpful?
Log in to tell us whether it helped, or to report a problem.
Last updated
Acceleration
The rate of change of velocity, measured in metres per second squared, m/s².
Resultant force
The single force that has the same effect as all the forces acting on an object combined.
Independent variable
The variable deliberately changed during an investigation.
Dependent variable
The variable measured or calculated to find the effect of changing the independent variable.
Control variable
A variable kept constant so that it does not affect the comparison being made.
Random error
An unpredictable variation between readings that causes results to scatter.
Systematic error
An error that shifts measurements consistently in one direction.
Put your knowledge into practice — try past paper questions for Combined Science: Synergy
Acceleration
The rate of change of velocity, measured in metres per second squared, m/s².
Resultant force
The single force that has the same effect as all the forces acting on an object combined.
Independent variable
The variable deliberately changed during an investigation.
Dependent variable
The variable measured or calculated to find the effect of changing the independent variable.
Control variable
A variable kept constant so that it does not affect the comparison being made.
Random error
An unpredictable variation between readings that causes results to scatter.
Systematic error
An error that shifts measurements consistently in one direction.
Use interval speeds at their middle times to estimate:
Repeat readings to reduce random timing error; electronic timing reduces reaction-time effects. Check distance markings and bench alignment for systematic error. Secure the pulley and loads, keep feet clear of falling masses and stop the trolley safely. Finish timing before the hanger reaches the floor.