Loading…


Loading…
Loading…
Loading…
AQA GCSE Combined Science Trilogy · 8464
AQA 8464 · 4.4.1.2 Rate of Photosynthesis Check the specification (PDF) (opens in a new tab)
Photosynthesis uses light energy to make glucose from carbon dioxide and water. Its rate describes how much photosynthesis happens in a given time. A faster rate means more glucose is produced per unit time, providing more material for plant growth.
Four important factors affect the rate: light intensity, carbon dioxide concentration, temperature and the amount of chlorophyll. Each affects a different part of the process: light supplies energy, carbon dioxide is a raw material, temperature affects enzyme-controlled reactions, and chlorophyll absorbs light.
Light intensity describes how much light reaches a surface. At low light intensity, increasing the intensity increases the rate of photosynthesis because more light energy is available. If other conditions remain unchanged, the rate eventually levels off: supplying still more light no longer increases photosynthesis.
On a graph with light intensity on the horizontal axis and photosynthesis rate on the vertical axis, this gives a rising section followed by a horizontal plateau. Photosynthesis continues at the plateau rate; it has not stopped.
Carbon dioxide concentration describes how much carbon dioxide is present in a given volume of air. Carbon dioxide is a reactant in photosynthesis. When its concentration is low, increasing it allows photosynthesis to happen faster, provided sufficient light and suitable conditions are available.
A graph of rate against carbon dioxide concentration also rises and then levels off. Once carbon dioxide is no longer restricting the process, adding more cannot increase the rate unless another condition is improved.
Photosynthesis involves reactions controlled by enzymes, biological catalysts that speed up reactions. At low temperatures, particles have less kinetic energy. There are fewer successful collisions between enzymes and their substrates, so photosynthesis is slow.
As temperature increases, particles move faster and successful collisions become more frequent. The rate rises towards an optimum temperature, where it is highest under those conditions.
Above the optimum, increasing temperature reduces the rate. Excessive heat can denature the enzymes: their active sites change shape, so their substrates no longer fit properly. The reactions can no longer proceed effectively.
A temperature–rate graph therefore rises to a peak and then falls, rather than simply reaching the plateau associated with increasing light or carbon dioxide. There is no single optimum temperature that should be assumed for every plant and every set of conditions.
Chlorophyll is the green pigment in chloroplasts that absorbs light energy for photosynthesis. A plant with less chlorophyll can absorb less light energy, reducing its capacity to photosynthesise. More chlorophyll can support a higher rate when the other conditions allow it.
For example, magnesium is needed to make chlorophyll, so magnesium deficiency can reduce chlorophyll production and photosynthesis. Diseases such as tobacco mosaic virus can also reduce the amount of chlorophyll. Losing leaves reduces the total number of chloroplasts available to the plant.
Bright light cannot fully compensate for a shortage of the pigment needed to absorb it.
A limiting factor is the condition currently restricting the rate. Improving it increases photosynthesis, but only until another condition becomes limiting. The limiting factor can therefore change as conditions change.
Consider a plant in dim light with sufficient carbon dioxide and a suitable temperature. Increasing the light intensity increases its photosynthesis rate: light is limiting. Adding carbon dioxide instead may have little effect, because the plant still lacks enough light energy to use it faster.
At higher light intensity, temperature or carbon dioxide concentration may become limiting. This explains why a light-intensity graph levels off. However, the plateau alone does not tell you which other factor is responsible: you need information about the conditions or a comparison with another curve.
The rate and light intensity are shown in arbitrary units to demonstrate the relationships, rather than predict exact rates for a particular plant.
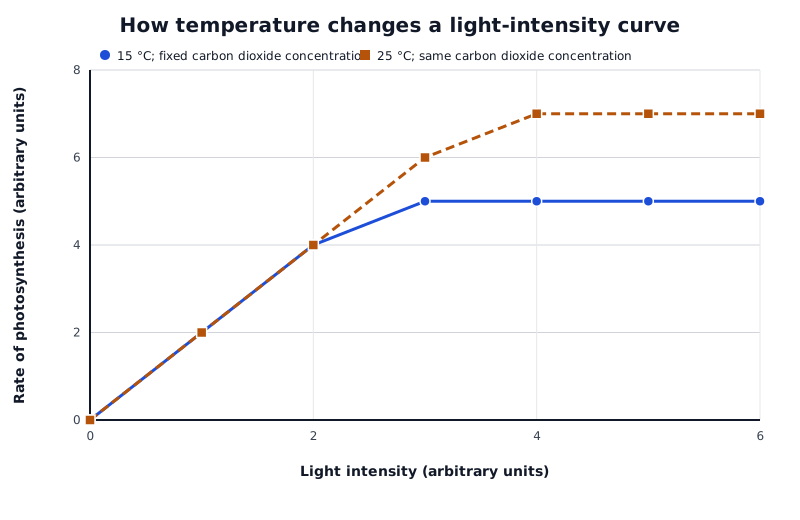
Curves at the same carbon dioxide concentration. At low light intensity the rates overlap; at higher light intensity, the warmer conditions allow a higher rate.
Data for How temperature changes a light-intensity curve
| Series | Light intensity (arbitrary units) | Rate of photosynthesis (arbitrary units) |
|---|---|---|
| 15 °C; fixed carbon dioxide concentration | 0 | 0 |
| 15 °C; fixed carbon dioxide concentration | 1 | 2 |
| 15 °C; fixed carbon dioxide concentration | 2 | 4 |
| 15 °C; fixed carbon dioxide concentration | 3 | 5 |
| 15 °C; fixed carbon dioxide concentration | 4 | 5 |
| 15 °C; fixed carbon dioxide concentration | 5 | 5 |
| 15 °C; fixed carbon dioxide concentration | 6 | 5 |
| 25 °C; same carbon dioxide concentration | 0 | 0 |
| 25 °C; same carbon dioxide concentration | 1 | 2 |
| 25 °C; same carbon dioxide concentration | 2 | 4 |
| 25 °C; same carbon dioxide concentration | 3 | 6 |
| 25 °C; same carbon dioxide concentration | 4 | 7 |
| 25 °C; same carbon dioxide concentration | 5 | 7 |
| 25 °C; same carbon dioxide concentration | 6 | 7 |
At low light intensity, the two curves overlap. Increasing light increases the rate at both temperatures, so light is limiting in this region.
At higher light intensity, the rate at 25 °C is greater than at 15 °C, although carbon dioxide concentration is the same. Increasing temperature has increased the rate, showing that temperature was restricting photosynthesis in the cooler conditions. This comparison assumes that both temperatures are below the temperature at which heat damage reduces the rate.
The cooler curve levels off sooner. At 25 °C, light remains limiting over a wider range of light intensities. Once both curves are horizontal, more light alone will not increase either rate.
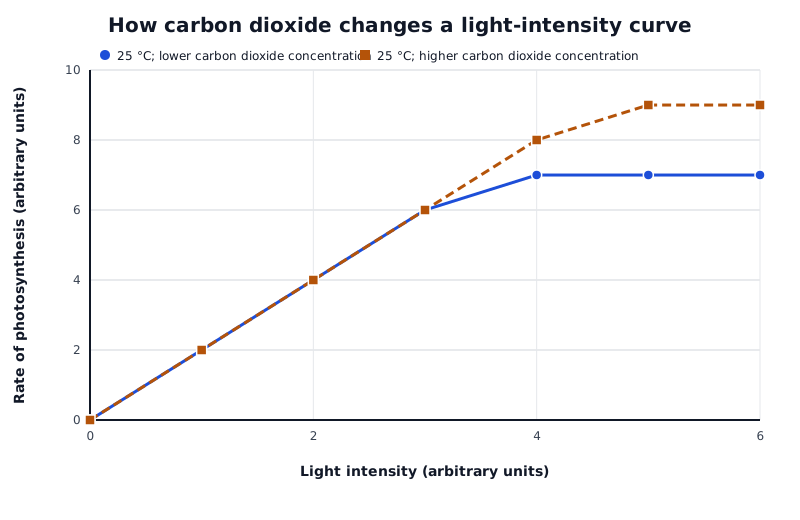
Curves at the same temperature. Carbon dioxide enrichment raises the rate at high light intensity, but has no effect where light is limiting.
Data for How carbon dioxide changes a light-intensity curve
| Series | Light intensity (arbitrary units) | Rate of photosynthesis (arbitrary units) |
|---|---|---|
| 25 °C; lower carbon dioxide concentration | 0 | 0 |
| 25 °C; lower carbon dioxide concentration | 1 | 2 |
| 25 °C; lower carbon dioxide concentration | 2 | 4 |
| 25 °C; lower carbon dioxide concentration | 3 | 6 |
| 25 °C; lower carbon dioxide concentration | 4 | 7 |
| 25 °C; lower carbon dioxide concentration | 5 | 7 |
| 25 °C; lower carbon dioxide concentration | 6 | 7 |
| 25 °C; higher carbon dioxide concentration | 0 | 0 |
| 25 °C; higher carbon dioxide concentration | 1 | 2 |
| 25 °C; higher carbon dioxide concentration | 2 | 4 |
| 25 °C; higher carbon dioxide concentration | 3 | 6 |
| 25 °C; higher carbon dioxide concentration | 4 | 8 |
| 25 °C; higher carbon dioxide concentration | 5 | 9 |
| 25 °C; higher carbon dioxide concentration | 6 | 9 |
Here, temperature is held at 25 °C and carbon dioxide concentration differs. At low light intensity, increasing carbon dioxide makes no difference: light is still limiting. At high light intensity, the higher carbon dioxide concentration produces a higher rate. Carbon dioxide was therefore limiting the lower curve in that region.
Together, the two graphs show interactions between light, temperature and carbon dioxide. At the same high light intensity, first increasing temperature and then increasing carbon dioxide can raise the rate. To interpret a graph involving three factors, read the conditions attached to each curve and find comparisons where only one condition changes. Identify the factor whose increase actually raises the rate at the light intensity being considered.
Greenhouses allow growers to control conditions more closely than outdoors. Heating can improve an otherwise low temperature, artificial lighting can increase light intensity, and added carbon dioxide can increase its concentration. Water and nutrients must also be supplied to keep plants healthy, including supporting chlorophyll production.
A higher photosynthesis rate can support faster growth, greater crop yield and more frequent harvests. These benefits can increase sales revenue, but heating, lighting, carbon dioxide supplies and greenhouse operation all cost money.
The grower must therefore consider profit, not just photosynthesis rate:
For example, adding carbon dioxide to a brightly lit greenhouse may increase yield enough to cover its cost. Adding it when light is limiting may produce little benefit, so the extra spending reduces profit. Similarly, heating beyond a useful temperature wastes money and may reduce photosynthesis through enzyme denaturation.
The best decision is to improve a limiting condition only where the extra crop income justifies the extra cost. The highest possible photosynthesis rate is not automatically the most profitable growing condition.
Get unlimited access to all revision notes, key terms, and exam tips.
Heating, lighting and carbon dioxide enrichment can improve photosynthesis and crop yield, but incur costs.
Improve conditions where extra crop income outweighs extra costs. Increasing a factor that is not limiting wastes money; maximum photosynthesis does not necessarily mean maximum profit.
Get unlimited access to all revision notes, key terms, and exam tips.
At low temperatures, explain the slower rate using fewer successful collisions. At excessively high temperatures, explain it using enzyme denaturation.
A plateau means that increasing the factor on the horizontal axis no longer increases the rate; it does not mean photosynthesis has stopped.
Higher Tier: compare curves where only one condition differs before identifying the limiting factor. A plateau alone does not identify which other factor is limiting.
Higher Tier: evaluate greenhouse improvements by comparing the extra income from the crop with the extra costs, not just by choosing the highest photosynthesis rate.
Rate of photosynthesis
The amount of photosynthesis occurring per unit time.
Chlorophyll
The green pigment in chloroplasts that absorbs light energy for photosynthesis.
Limiting factor
A condition that restricts the rate of a process; improving that condition increases the rate until another condition becomes limiting.
Optimum temperature
The temperature at which a process has its highest rate under the given conditions.
Denaturation
A change in an enzyme’s shape, including its active site, so that its substrate no longer fits and the enzyme cannot catalyse the reaction effectively.
Profit
The money remaining from sales revenue after costs have been subtracted.
Put your knowledge into practice — try past paper questions for Combined Science Trilogy
Rate of photosynthesis
The amount of photosynthesis occurring per unit time.
Chlorophyll
The green pigment in chloroplasts that absorbs light energy for photosynthesis.
Limiting factor
A condition that restricts the rate of a process; improving that condition increases the rate until another condition becomes limiting.
Optimum temperature
The temperature at which a process has its highest rate under the given conditions.
Denaturation
A change in an enzyme’s shape, including its active site, so that its substrate no longer fits and the enzyme cannot catalyse the reaction effectively.
Profit
The money remaining from sales revenue after costs have been subtracted.