Loading…


Loading…
Loading…
Loading…
AQA GCSE Combined Science Trilogy · 8464
AQA 8464 · 4.4.1.2 Rate of Photosynthesis Check the specification (PDF) (opens in a new tab)
Photosynthesis releases oxygen. When an aquatic plant such as pondweed photosynthesises underwater, some of this oxygen escapes as bubbles. Measuring oxygen production therefore gives an estimate of the rate of photosynthesis: how much photosynthesis occurs in a given time.
A simple method is to count the bubbles released during a fixed time. A faster rate produces more bubbles in that time. The calculation is:
The time unit determines the rate unit. Dividing by time in minutes gives bubbles per minute; dividing by time in seconds gives bubbles per second.
Bubbles are not necessarily the same size, so bubble count is only an approximate measure of oxygen production. An improvement is to collect the gas in a gas syringe and measure its volume over a known time:
For example, measuring volume in cm³ and time in minutes gives a rate in cm³/min.
AQA required practical activity 5 investigates the effect of light intensity on photosynthesis using an aquatic organism such as pondweed. Moving a lamp changes the light reaching the plant: a nearer lamp usually provides greater light intensity.
Use a fresh piece of pondweed, a boiling tube held in a rack, sodium hydrogencarbonate solution, an LED lamp, a ruler and a stopwatch. Sodium hydrogencarbonate supplies carbon dioxide for photosynthesis. A thermometer can be used to check that the solution stays at the same temperature.
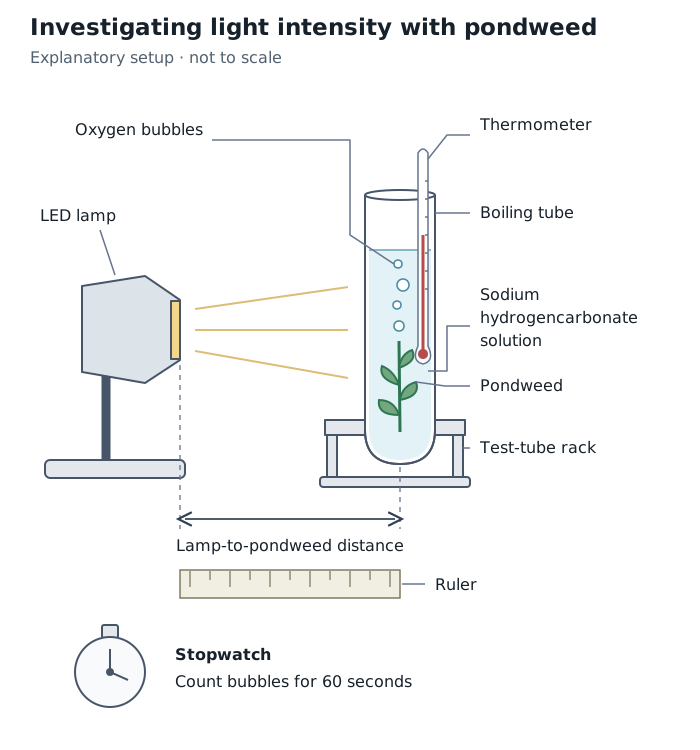
Move the lamp to change light intensity, while keeping other conditions constant and counting oxygen bubbles over a fixed time.
Place the pondweed in the solution and position the lamp a measured distance from it. Measure consistently from the lamp to the pondweed, rather than changing the reference point between readings.
Allow the plant time to adjust to the light level before counting. For example, wait five minutes, then count the bubbles produced in 60 seconds. Repeat the count twice more at the same distance, giving three readings.
Move the lamp to a new distance, allow the plant to adjust again and repeat the measurements. Suitable distances are 10, 20, 30 and 40 cm. Record all readings in a table and calculate the mean at each distance.
The independent variable is lamp distance, used to change light intensity. The dependent variable is the measured rate of oxygen production.
Keep other conditions constant so that differences in rate can be attributed to the change in light:
Temperature control is particularly important. A lamp that heats the water as it moves closer would change both light intensity and temperature, making the effect of light alone harder to identify.
Repeats reveal how consistent the readings are. Calculate a mean to reduce the influence of random variation. If one reading is very different from the others, investigate and take further readings rather than simply ignoring it.
Each count was made over one minute.
| Lamp distance (cm) | Count 1 | Count 2 | Count 3 | Mean rate (bubbles/min) |
|---|---|---|---|---|
| 10 | 48 | 50 | 52 | 50 |
| 20 | 24 | 25 | 26 | 25 |
| 30 | 11 | 12 | 13 | 12 |
| 40 | 6 | 7 | 8 | 7 |
At 20 cm, the mean count is bubbles. Because the counting period was one minute, the mean rate is 25 bubbles/min. For a different counting period, divide the mean count by that time rather than treating the count itself as the rate.
Plot lamp distance on the horizontal axis and mean bubbling rate on the vertical axis. Label both axes with units and choose evenly spaced scales that use a substantial part of the available graph area. For these data, horizontal intervals of 10 cm and vertical intervals of 10 bubbles/min are convenient.
Each table row becomes a coordinate pair. For example, the 20 cm row becomes the point . Plot all the points accurately. For continuous measurements such as distance, draw an appropriate smooth curve of best fit rather than a bar chart or a dot-to-dot line that follows every small variation.
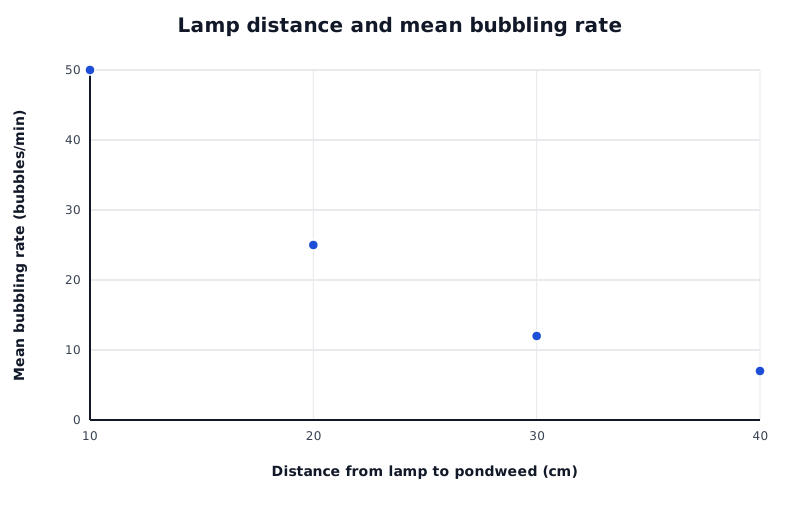
Constructed practice data: each point translates one row of the table into a distance and mean bubbling rate.
Data for Lamp distance and mean bubbling rate
| Series | Distance from lamp to pondweed (cm) | Mean bubbling rate (bubbles/min) |
|---|---|---|
| Mean bubbling rate | 10 | 50 |
| Mean bubbling rate | 20 | 25 |
| Mean bubbling rate | 30 | 12 |
| Mean bubbling rate | 40 | 7 |
To translate the graph back into numbers, locate a distance on the horizontal axis, move vertically to the plotted point or fitted curve, then read across to the rate axis. At 30 cm, these practice data give 12 bubbles/min. You can also work backwards: a rate of 25 bubbles/min corresponds to a distance of 20 cm.
The rate falls as the lamp moves further away. Less light reaches the pondweed, so photosynthesis slows and fewer oxygen bubbles are released per minute. Describe the trend using values as well as words: increasing distance from 10 to 20 cm reduces the rate from 50 to 25 bubbles/min in this example.
On a graph with light intensity, rather than distance, on the horizontal axis, the rate usually rises as light intensity increases. If the curve levels off, increasing light intensity is no longer increasing the rate: another factor is restricting photosynthesis. The horizontal-axis label therefore matters when interpreting the direction of a trend.
For the inverse square model, light intensity is proportional to the reciprocal of the square of the distance from the light source:
Here, is light intensity and is distance. The symbol means ‘is proportional to’. Doubling the distance makes the intensity one-quarter as large; tripling the distance makes it one-ninth as large. Halving the distance makes the intensity four times as large.
You can process distance readings by calculating :
| Distance (cm) | Relative light intensity, calculated as (arbitrary units) |
|---|---|
| 10 | 0.0100 |
| 20 | 0.0025 |
| 40 | 0.000625 |
At 20 cm, . This is a relative intensity value, not an absolute measurement in lux. Use the same distance unit throughout a comparison.
These calculated values can replace distance on the horizontal axis of a photosynthesis-rate graph. They allow you to examine the relationship between rate and relative light intensity more directly. However, the inverse square law describes light intensity, not automatically photosynthesis rate: the rate need not keep increasing if another factor becomes limiting.
Get unlimited access to all revision notes, key terms, and exam tips.
Investigate light intensity using pondweed:
Typical units: cm³/min or bubbles/min. Collecting gas in a gas syringe improves on bubble counting because bubble volumes vary.
Double distance → quarter intensity. Triple distance → one-ninth intensity.
Calculate using consistent distance units; report relative intensity in arbitrary units. Photosynthesis rate does not necessarily follow the same relationship.
Get unlimited access to all revision notes, key terms, and exam tips.
State what you measure and for how long: ‘count oxygen bubbles for 60 seconds’ is more precise than ‘measure photosynthesis’.
Explain control variables: keeping temperature constant prevents heating by the lamp from affecting the rate.
Label graph axes with quantities and units. Distance belongs on the horizontal axis; mean photosynthesis rate belongs on the vertical axis.
Bubble counts are only an estimate of oxygen production because bubbles can have different volumes.
Higher Tier: light intensity is proportional to 1/d², not 1/d. Do not assume that photosynthesis rate always follows the inverse square law.
Rate of photosynthesis
The amount of photosynthesis occurring per unit time, estimated experimentally by oxygen production per unit time.
Light intensity
The amount of light reaching a given area per unit time.
Independent variable
The factor deliberately changed during an investigation, such as the distance between a lamp and pondweed.
Dependent variable
The quantity measured to find the effect of changing the independent variable, such as oxygen bubbles produced per minute.
Control variable
A factor kept constant so that it does not affect the comparison between results.
Inverse square law
Higher Tier: a relationship in which a quantity is proportional to the reciprocal of distance squared. For light intensity, .
Put your knowledge into practice — try past paper questions for Combined Science Trilogy
Rate of photosynthesis
The amount of photosynthesis occurring per unit time, estimated experimentally by oxygen production per unit time.
Light intensity
The amount of light reaching a given area per unit time.
Independent variable
The factor deliberately changed during an investigation, such as the distance between a lamp and pondweed.
Dependent variable
The quantity measured to find the effect of changing the independent variable, such as oxygen bubbles produced per minute.
Control variable
A factor kept constant so that it does not affect the comparison between results.
Inverse square law
Higher Tier: a relationship in which a quantity is proportional to the reciprocal of distance squared. For light intensity, .