

Loading…
Loading…
Loading…
OCR GCSE Combined Science B · J260
OCR J260 · M2 Handling Data Check the specification (PDF) (opens in a new tab)
Counting every plant in a large field, or testing every object in a large batch, may take too long or be impractical. Scientists therefore investigate a sample: a smaller selection from the whole population. Here, population means the entire group being investigated, not necessarily people or organisms.
The sample provides an estimate rather than an exact measurement of the whole population. For that estimate to be useful, the sample should be representative: it should reflect the variation within the population. Sampling only the most convenient places can give a misleading picture.
Suppose you want to estimate the number of plants in a field. Plants may grow in patches, so choosing only places where many plants are visible would overestimate their abundance. Choosing only bare patches would underestimate it. This systematic favouring of particular locations is sampling bias.
Random sampling removes personal choice from the selection of locations. A standard method uses a quadrat, a frame enclosing a known area:
Check for uneven ground and other hazards before sampling, avoid damaging organisms unnecessarily, and wash your hands after handling soil or plants. Sampling is complete when the planned set of locations has been counted and recorded.
A larger, well-selected sample usually gives a more reliable estimate because an unusually crowded or empty quadrat has less influence on the overall result. However, taking more samples from the same biased locations does not make the method representative.
First calculate the mean number of plants per unit area:
Then scale this density up:
For example, five quadrats, each with an area of , contain 20, 25, 47, 12 and 5 daffodils. The total count is 109 and the total sampled area is . The density is therefore daffodils per square metre. In a field, this gives an estimated of , or about 2200 daffodils.
The estimate assumes the sampled areas represent the field as a whole. It does not mean that every square metre contains the same number of plants.
Not every investigation needs randomly scattered locations. To study how plant abundance changes with distance from a tree, quadrats can be placed at regular intervals along a measuring tape. This is systematic sampling using a belt transect.
Record the distance and plant count at each position. Measuring light intensity at the same positions can help investigate whether the distribution is associated with changing light conditions. Random sampling is useful for estimating abundance across an area; a transect is useful for investigating a pattern along a route.
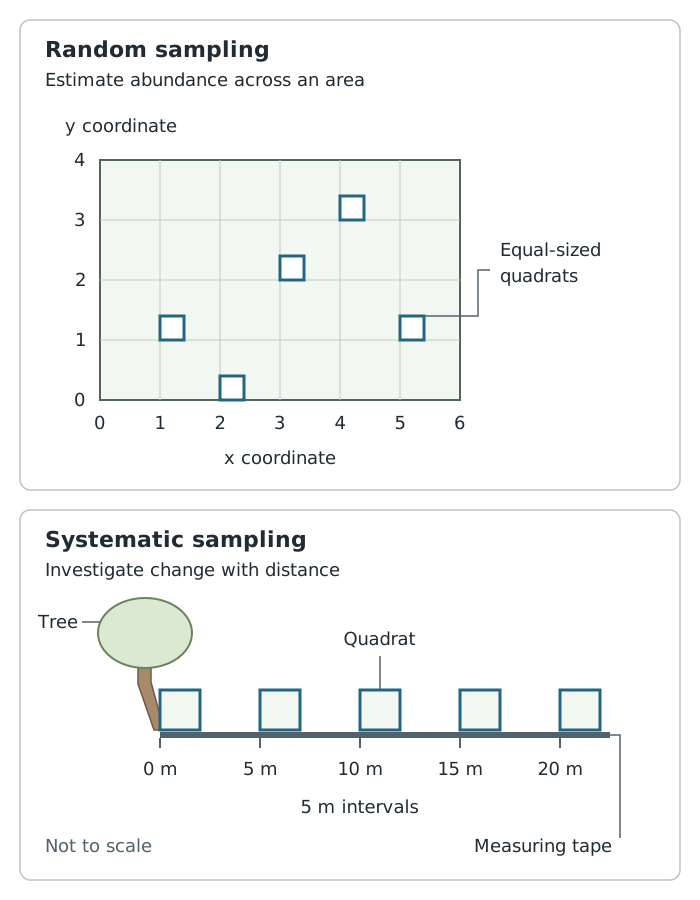
Random locations sample the wider area; regular intervals along a transect reveal changes with distance.
Probability is the likelihood of an event occurring. An outcome is a possible result; an event is the result, or group of results, you are interested in.
Probability runs from 0 to 1. A probability of 0 means impossible, 1 means certain, and means an even chance. Values between 0 and describe unlikely events; values between and 1 describe likely events. Probabilities have no units and can be written as fractions, decimals or percentages.
When individual outcomes are equally likely:
A fair six-sided die has six equally likely outcomes. Only one is a 2, so . The outcomes greater than 2 are 3, 4, 5 and 6, giving a probability of .
An event either happens or does not happen, so these probabilities add to 1:
More generally, probabilities add to 1 for a complete set of outcomes that cannot occur together in the same trial.
In scientific investigations, probability may be estimated from observed results rather than calculated from equally likely outcomes. The relative frequency is:
For example, if a coin lands on heads 325 times in 500 flips, the relative frequency of heads is . This provides an estimate of its probability of landing on heads. More trials generally make a probability estimate less affected by chance variation, provided the conditions remain comparable.
To predict how often an event will occur, multiply its probability by the number of trials. For a fair die rolled 24 times, the expected number of 2s is . The actual number may differ: probability predicts patterns over repeated trials, not the result of each individual trial.
Explain how random coordinates are chosen; saying ‘place quadrats randomly’ is less precise.
A larger sample reduces the influence of chance variation, but does not correct a biased sampling method.
When scaling up quadrat counts, use the total sampled area, not just the number of quadrats.
Count favourable outcomes over all possible outcomes only when the individual outcomes are equally likely.
An expected frequency is a prediction, not a guaranteed result.
It can see this note and what your specification asks for.
Answers are free with an account.
1 free note left this week
Get more free notesYour answer sets when this note comes back for review, or marks it complete.
Was this note helpful?
Log in to tell us whether it helped, or to report a problem.
Last updated
Population
The whole group of organisms, objects or measurements that an investigation concerns.
Sample
A smaller selection from a population, used to obtain information about the whole population.
Representative sample
A sample that reflects the relevant characteristics and variation of the population being investigated.
Random sampling
Selecting samples by chance so that each eligible sampling unit has an equal chance of selection.
Sampling bias
A systematic tendency in a sampling method to favour particular parts of a population, making the sample unrepresentative.
Quadrat
A frame enclosing a known area, used to sample organisms such as plants.
Probability
The likelihood of an event occurring, expressed as a number from 0 to 1.
Relative frequency
The proportion of trials in which an event occurred: .
Expected frequency
The predicted number of occurrences of an event over repeated trials, calculated as probability multiplied by the number of trials.
Put your knowledge into practice — try past paper questions for Combined Science B
Population
The whole group of organisms, objects or measurements that an investigation concerns.
Sample
A smaller selection from a population, used to obtain information about the whole population.
Representative sample
A sample that reflects the relevant characteristics and variation of the population being investigated.
Random sampling
Selecting samples by chance so that each eligible sampling unit has an equal chance of selection.
Sampling bias
A systematic tendency in a sampling method to favour particular parts of a population, making the sample unrepresentative.
Quadrat
A frame enclosing a known area, used to sample organisms such as plants.
Probability
The likelihood of an event occurring, expressed as a number from 0 to 1.
Relative frequency
The proportion of trials in which an event occurred: .
Expected frequency
The predicted number of occurrences of an event over repeated trials, calculated as probability multiplied by the number of trials.
Relative frequency comes from observed results; expected frequency is a prediction.