

Loading…
Loading…
Loading…
OCR GCSE Combined Science B · J260
OCR J260 · Measuring Rates and Enzymatic Catalysis Check the specification (PDF) (opens in a new tab)
A reaction rate tells us how much chemical change happens in a given time. We can measure how quickly a reactant is used up or how quickly a product forms. For example, magnesium reacting with hydrochloric acid produces hydrogen: measuring the hydrogen collected tells us how the reaction progresses.
The measurement must suit the reaction. A gas-producing reaction can be followed by measuring gas volume or, if the gas escapes, the decrease in mass of the apparatus and its contents. Other reactions can be followed through a colour change or the appearance of a solid precipitate.
For any measured interval:
If the amount is a gas volume in cm³ and time is in seconds, the rate is in cm³/s. If it is a mass in grams, the rate is in g/s. These measurements let chemists compare conditions and control how quickly useful chemicals are made.
For magnesium and dilute hydrochloric acid, connect a reaction flask to a gas syringe using a bung and delivery tube. The tube passes through the bung into the flask's headspace, providing a continuous passage for hydrogen to enter the syringe. The hydrogen pushes the syringe plunger outwards, so its scale shows the volume collected.
Measure the reactants, prepare the apparatus, then mix the reactants, fit the bung promptly and start the timer as mixing begins. Record gas volume at regular intervals, such as every 10 seconds, until the reading stops increasing. A leak or a delay in fitting the bung allows gas to escape before it is measured. The syringe plunger must move freely, and the apparatus must have enough capacity for the gas produced.
Alternatively, fill a measuring cylinder with water and invert it in a trough of water, keeping its opening submerged. Connect the flask's headspace to a delivery tube passing through the bung, with its outlet beneath the cylinder's submerged opening. Gas enters the cylinder and displaces water; read the collected gas volume at regular time intervals. This method is suitable only when the gas does not dissolve appreciably in water or react with it.
Wear eye protection when handling acids. Clamp collection apparatus securely, keep hydrogen away from flames, and never trap a gas-producing reaction in a sealed container with no safe route for the gas to expand.
Calcium carbonate reacts with hydrochloric acid to produce carbon dioxide. The starting mass must include the flask, both reactants and the loose cotton-wool plug that will be used during the reaction.
Before mixing, weigh the flask containing the dilute acid together with its cotton-wool plug. Measure the mass of the calcium carbonate separately, excluding its weighing container. Add these two masses to obtain the combined starting mass. Put the flask on the balance, add all the weighed calcium carbonate, start the timer as the reactants mix and promptly replace the loose plug. Record the mass at regular intervals. As carbon dioxide escapes, the measured mass decreases.
A loose cotton-wool plug in the flask neck allows gas to escape while reducing the loss of droplets. Do not use an airtight bung for this method. Wear eye protection and use small quantities of dilute acid.
The decrease in mass measures the mass of gas that has escaped, provided other material is not lost. For each reading:
Continue until the mass is no longer changing. This method works well for carbon dioxide but is less useful for hydrogen: the mass of hydrogen released may be too small for a school balance to measure accurately.
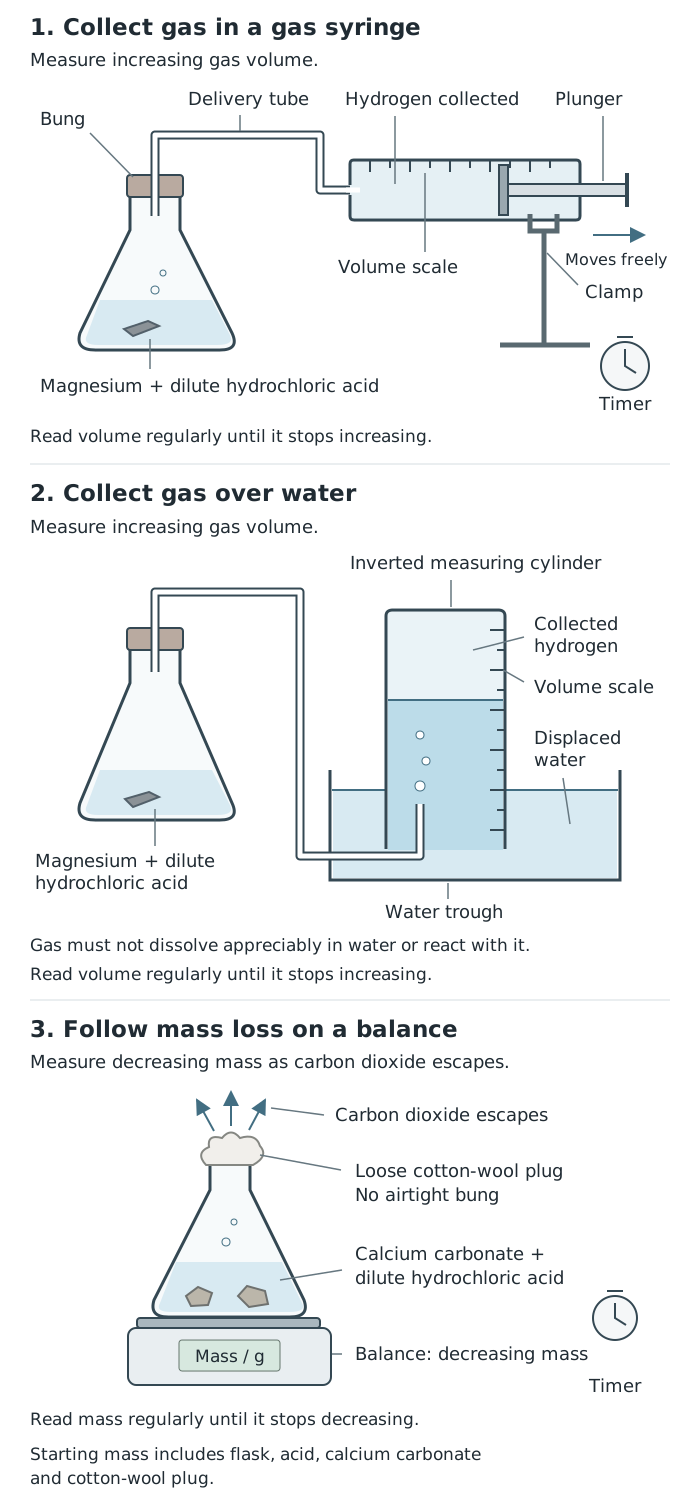
Gas collection measures increasing gas volume; a balance measures decreasing mass as gas escapes.
A precipitate is an insoluble solid formed during a reaction in solution. Sodium thiosulfate and hydrochloric acid produce a sulfur precipitate that makes the mixture increasingly cloudy.
Place the flask over a black cross on paper. Add the acid, start the timer and look down through the mixture. Stop timing when the cross can no longer be seen. This is a defined endpoint: it does not mean that the whole reaction has finished.
To compare experiments fairly, keep the total volume and depth of liquid the same, use the same cross, lighting and viewing position, and preferably the same observer. Judging exactly when the cross disappears is subjective. Repeat each condition and compare the results. Wear eye protection; this reaction also releases irritating sulfur dioxide, so use small quantities in a well-ventilated laboratory and avoid breathing the fumes.
Colour can provide a similar signal. For example, purple potassium manganate(VII) solution can lose its colour as it reacts. Start timing when the reactants are mixed and stop at a consistently defined colour endpoint. If comparable mixtures reach the same endpoint, a shorter time indicates a faster reaction.
A single endpoint time gives one result for that experiment, not a continuous record of its changing rate. Gas-volume and balance measurements provide readings throughout the reaction.
Place time on the horizontal axis and the measured quantity on the vertical axis. Label both axes with units, choose sensible evenly spaced scales, and plot each reading accurately. Draw a smooth best-fit curve where the trend is curved rather than forcing a straight line through all the points.
The following example shows possible gas-volume readings for two reactions that produce the same total amount of gas under different conditions.
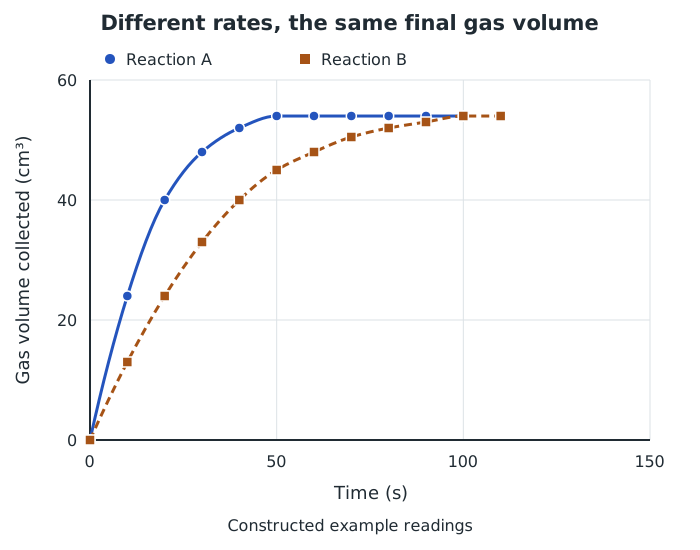
Example readings with smooth best-fit curves: reaction A produces gas faster, but both reactions eventually produce 54 cm³.
Both curves rise because gas accumulates. Reaction A is initially steeper: it produces more gas per second and is therefore faster. Both become less steep as the reactions slow down, then level off when no further gas is produced.
The plateau gives the final gas volume; the time at which the curve becomes horizontal indicates when gas production has stopped. Here both reactions reach 54 cm³, but A reaches that volume sooner. Changing the rate need not change the final amount of product.
A graph of reactant remaining, or the mass remaining in a flask as gas escapes, instead slopes downwards. A faster decrease has a steeper downward slope. Its gradient is negative, but the rate of reactant use or mass loss is normally reported as a positive magnitude.
For a mean rate between two times, subtract the earlier amount from the later amount and divide by the elapsed time. On the example graph, reaction A increases from 24 cm³ at 10 s to 48 cm³ at 30 s:
This is the average rate over those 20 seconds. It does not mean that the reaction ran at that rate throughout the interval.
To find the rate at a particular moment, draw a tangent to the curve at that time. Position a ruler so the line follows the curve's direction at the chosen point. Then select two widely separated points on the tangent and calculate:
For example, suppose a tangent on a gas-volume graph passes through 28 cm³ at 10 s and 52 cm³ at 30 s. Its gradient is . These are points on the tangent; they need not be measured points on the reaction curve. A tangent at the start gives the initial rate, while a horizontal tangent at the plateau gives zero rate.
Rates can be compared using a ratio. If two comparable reactions have rates of 2.0 cm³/s and 0.5 cm³/s, their rate ratio is : the first is four times as fast.
When timing a fixed endpoint, the same amount of change must happen in each experiment. Under that condition:
Suppose the same cross-disappearance endpoint takes 40 s in one experiment and 20 s in another. Their comparison measures are and . The second is twice as fast. Here is a measure proportional to rate, not a measured mass or volume of product per second.
To investigate a factor such as concentration, vary that factor while keeping the other relevant conditions constant. Use consistent timing and measurement methods, repeat experiments and compare mean results. For a concentration investigation, this includes controlling temperature, total solution volume and the amount and surface area of any solid reactant.
Direct proportionality is a stronger claim than saying that rate increases. If doubling concentration doubles rate, and other results show the same constant rate-to-concentration ratio, the data support direct proportionality over the range tested. A graph of rate against concentration would then be a straight line through the origin. Do not assume that every factor has this relationship: use the measured ratios and graph to decide.
Control other relevant variables and repeat measurements. Wear eye protection; keep hydrogen away from flames and avoid sulfur dioxide fumes.
Time goes on the horizontal axis; measured amount and units go on the vertical axis. Plot accurately and draw an appropriate smooth best-fit curve.
Use cm³/s for gas-volume rate or g/s for mass-change rate. Report the positive magnitude for reactant use or mass loss.
For the same fixed endpoint, : halving the time doubles the rate.
Direct proportionality requires a constant ratio, represented by a straight-line graph through the origin. Establish it from data rather than assuming it.
Choose a method that measures an observable change in the given reaction, and state what you will measure and how you will measure time.
Distinguish the mass remaining, which decreases, from cumulative mass lost, which increases.
For a tangent gradient, use two well-separated points on the tangent, not two points on the curve.
Include units: gas-volume rates may be in cm³/s, mass-change rates in g/s, and the comparison measure 1/t in s⁻¹.
Use 1/t to compare endpoint times only when each experiment reaches the same endpoint under comparable conditions.
A higher final gas volume means more gas was produced, not necessarily that the reaction was faster.
It can see this note and what your specification asks for.
Answers are free with an account.
1 free note left this week
Get more free notesYour answer sets when this note comes back for review, or marks it complete.
Was this note helpful?
Log in to tell us whether it helped, or to report a problem.
Last updated
Rate of reaction
The amount of reactant used up or product formed per unit time.
Mean rate
The change in an amount divided by the time taken over a specified interval.
Instantaneous rate
The rate at a particular moment, found from the gradient of a tangent to an amount–time curve.
Precipitate
An insoluble solid that forms in a solution during a reaction.
Tangent
A straight line that follows the direction of a curve at a chosen point.
Gradient
The change in the vertical-axis quantity divided by the corresponding change in the horizontal-axis quantity: .
Endpoint
A defined, observable stage used to stop timing, such as a cross disappearing or a colour disappearing.
Direct proportionality
A relationship in which one quantity increases by the same factor as another, so their ratio remains constant.
Put your knowledge into practice — try past paper questions for Combined Science B
Rate of reaction
The amount of reactant used up or product formed per unit time.
Mean rate
The change in an amount divided by the time taken over a specified interval.
Instantaneous rate
The rate at a particular moment, found from the gradient of a tangent to an amount–time curve.
Precipitate
An insoluble solid that forms in a solution during a reaction.
Tangent
A straight line that follows the direction of a curve at a chosen point.
Gradient
The change in the vertical-axis quantity divided by the corresponding change in the horizontal-axis quantity: .
Endpoint
A defined, observable stage used to stop timing, such as a cross disappearing or a colour disappearing.
Direct proportionality
A relationship in which one quantity increases by the same factor as another, so their ratio remains constant.