

Loading…
Loading…
Loading…
OCR GCSE Combined Science B · J260
OCR J260 · Cellular Transport and Plant Vessels Check the specification (PDF) (opens in a new tab)
Water evaporates from surfaces inside a leaf and the water vapour diffuses out through open stomata. This loss of water is transpiration. As water is lost, more water is drawn along the xylem towards the leaves.
A potometer measures how much water a leafy shoot takes up over time. Faster uptake usually indicates faster transpiration. However, it is not a direct measurement of water loss: some of the absorbed water is used in photosynthesis and growth rather than transpired.
A simple potometer connects a leafy shoot to a water-filled tube and a graduated pipette. As the shoot takes up water, the meniscus moves along the pipette’s scale. The change in the volume reading shows the volume absorbed.
The apparatus must provide the shoot’s only water supply, without leaking. To achieve this:
Handle glass tubing gently rather than forcing it into a connection. A teacher should supervise cutting the stem with a sharp blade. Keep electrical lamps and fans away from water, dry spills promptly and avoid touching a hot lamp.
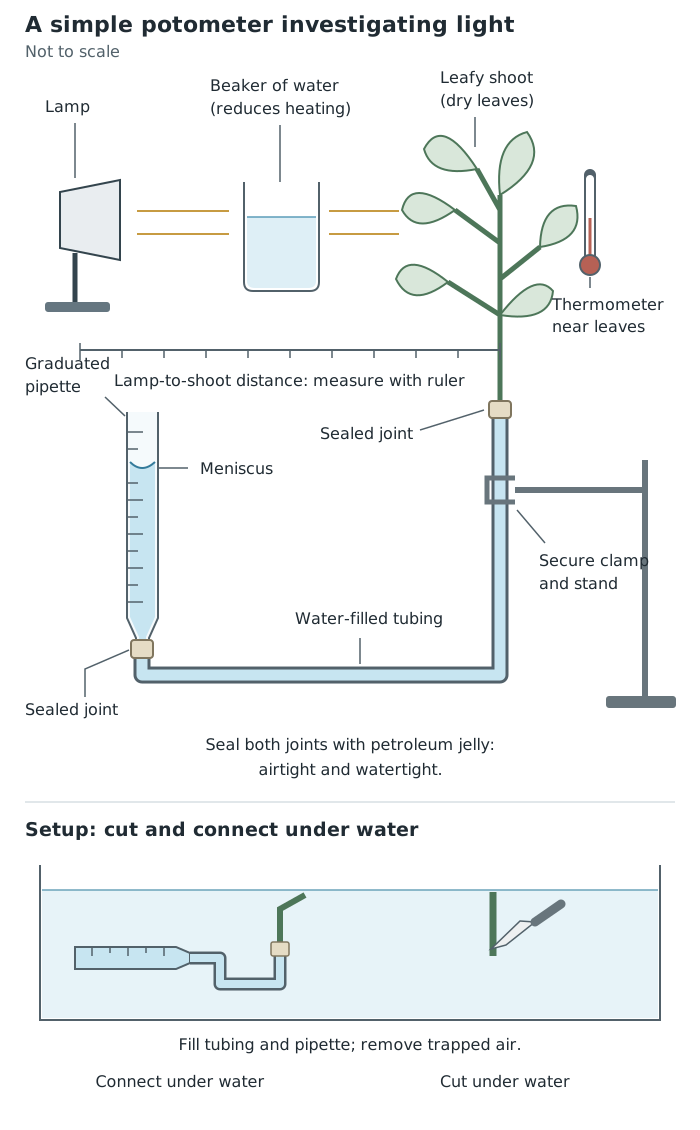
The change in pipette reading measures water uptake. Vary lamp distance while monitoring temperature and keeping other conditions constant.
Allow the shoot to adjust to the experimental conditions. Steady movement of the meniscus, with no leaks or unwanted bubbles, indicates that the apparatus is ready for measurements.
Record the starting pipette reading and start a stopwatch. After a measured interval, record the final reading and elapsed time. Choose an interval long enough for the movement to be read clearly; a slowly moving meniscus needs a longer measurement period.
The volume taken up is the difference between the readings. Check which way the pipette scale runs: water uptake is a positive quantity even if its scale reading decreases. Read the meniscus at eye level to avoid a viewing-angle error.
Another type of potometer follows an air bubble moving along a narrow capillary tube. Here, record the bubble’s starting and finishing positions. A deliberately introduced measuring bubble is different from unwanted air trapped elsewhere in the apparatus. Its distance travelled per unit time provides a way to compare uptake rates using the same tube.
Light intensity: in brighter light, stomata generally open to allow carbon dioxide into the leaf for photosynthesis. More water vapour can then escape, so transpiration and water uptake generally increase.
Air movement: still air allows water vapour to accumulate around a leaf. Moving air carries this moist air away, maintaining a steeper water-vapour concentration gradient between the leaf’s air spaces and the surrounding air. Diffusion out of the leaf is faster, increasing transpiration and uptake.
Temperature: higher temperatures increase evaporation within the leaf and the rate of diffusion of water vapour. Provided the plant has sufficient water, transpiration and uptake generally increase.
Humidity also matters. Humid air produces a smaller water-vapour concentration gradient, so transpiration is slower than in dry air. These trends are not unlimited: if water loss becomes excessive, stomata may close and restrict further loss.
To investigate light, place a lamp at several measured distances from the shoot. A greater distance gives a lower light intensity. If a light meter is available, measure the intensity at the leaves; otherwise record lamp distance as the variable you change.
Use the same shoot throughout to keep leaf surface area constant. Keep air movement and humidity as constant as possible. A clear beaker of water between the lamp and shoot can help absorb heat, but also monitor the temperature near the leaves rather than assuming that it stays constant.
At each lamp position, allow the shoot to adjust, then measure water uptake over a known interval. Repeat measurements at each position and calculate a mean rate. Record the lamp distance, starting and final readings, elapsed time and calculated rate in a table with units in its headings.
For an air-movement investigation, use a fan at different settings or distances while keeping light, temperature and humidity constant. Record the setting or distance; use an air-speed meter if actual air speed is being measured.
For a temperature investigation, use environments at different measured temperatures while keeping light, air movement and humidity as constant as possible. Simply moving a lamp closer would change both temperature and light, so it would not isolate temperature’s effect.
Repeats help show how consistent the measurements are. If a result is very different from the others, check for a leak, trapped air or a change in conditions and repeat the measurement rather than automatically discarding it.
A rate expresses how much changes per unit time:
For example, suppose a pipette’s uptake scale increases from to over . The volume taken up is , giving:
This means the shoot absorbed about each minute on average. The rate lets us compare trials even when their measurement times differ.
For a bubble potometer, use distance travelled divided by time. A bubble travelling in has a movement rate of . This is a distance rate, not a volume rate.
For continuous variables such as lamp distance or temperature, plot a scatter graph. Put the independent variable on the horizontal axis and mean water uptake rate on the vertical axis. Label both axes with the quantity and unit, choose evenly spaced scales that use the available space, and plot each point accurately. Draw a suitable line or smooth curve of best fit to show the trend rather than forcing it through every point.
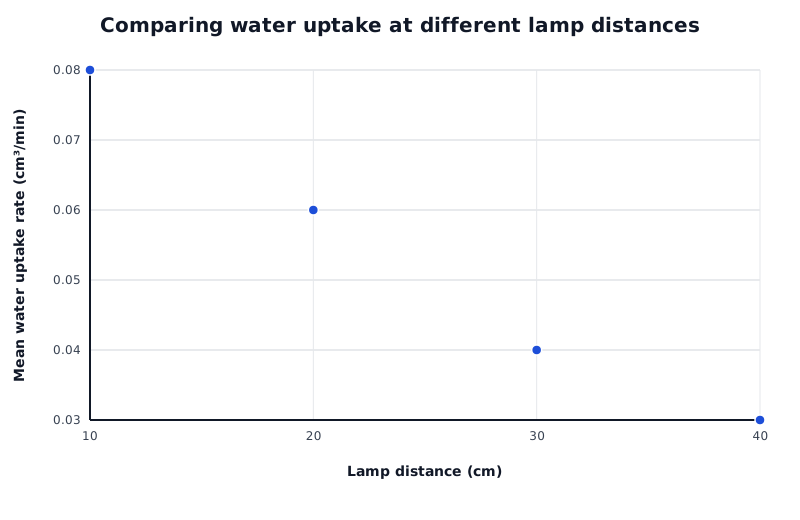
Suppose these mean rates were obtained at four lamp distances while other conditions were held constant. Uptake falls as the lamp moves further away.
Data for Comparing water uptake at different lamp distances
| Series | Lamp distance (cm) | Mean water uptake rate (cm³/min) |
|---|---|---|
| Mean water uptake rate | 10 | 0.08 |
| Mean water uptake rate | 20 | 0.06 |
| Mean water uptake rate | 30 | 0.04 |
| Mean water uptake rate | 40 | 0.03 |
In this constructed example, uptake decreases as lamp distance increases. This is consistent with lower light intensity reducing stomatal opening and therefore water loss. The pattern is not a straight-line decrease, so doubling the distance does not necessarily halve uptake.
When interpreting your own results, describe the overall trend and support it with values. Look for points that do not fit the pattern and consider whether repeat results are close together. A trend supports a conclusion about the factor investigated only if other relevant conditions were controlled.
You can also plot volume taken up against elapsed time. The gradient represents uptake rate: a steeper section means faster uptake, while a straight line indicates a constant rate.
Investigate one factor at a time. Keep leaf area and other environmental conditions constant; moving a lamp can change both light and temperature.
A potometer measures water uptake, not water loss directly. Water uptake is an estimate of transpiration because some absorbed water is used in photosynthesis and growth.
Calculate the change in the reading before dividing by time. Include a rate unit, such as cm³/min or mm/min.
When changing lamp distance, control temperature as well as air movement and humidity: a lamp can heat the shoot.
Bubble distance per minute is not a volume per minute. Compare distance rates only when the capillary tube has the same bore.
Describe a graph’s trend using its variables, then explain the biological reason. Do not assume that every relationship is directly proportional.
It can see this note and what your specification asks for.
Answers are free with an account.
1 free note left this week
Get more free notesYour answer sets when this note comes back for review, or marks it complete.
Was this note helpful?
Log in to tell us whether it helped, or to report a problem.
Last updated
Transpiration
The loss of water vapour from a plant, mainly through the stomata in its leaves.
Potometer
An apparatus used to measure water uptake by a leafy shoot over time.
Rate
A measure of change per unit time; water uptake rate is the volume of water absorbed divided by the time taken.
Independent variable
The variable deliberately changed in an investigation, such as lamp distance.
Dependent variable
The variable measured in an investigation, such as water uptake rate.
Control variable
A variable kept constant so that its effect does not interfere with the relationship being investigated.
Meniscus
The curved surface of a liquid, whose position can be read against a measuring scale.
Put your knowledge into practice — try past paper questions for Combined Science B
Transpiration
The loss of water vapour from a plant, mainly through the stomata in its leaves.
Potometer
An apparatus used to measure water uptake by a leafy shoot over time.
Rate
A measure of change per unit time; water uptake rate is the volume of water absorbed divided by the time taken.
Independent variable
The variable deliberately changed in an investigation, such as lamp distance.
Dependent variable
The variable measured in an investigation, such as water uptake rate.
Control variable
A variable kept constant so that its effect does not interfere with the relationship being investigated.
Meniscus
The curved surface of a liquid, whose position can be read against a measuring scale.