

Loading…
Loading…
Loading…
Eduqas GCSE Geography B · C112
Eduqas C112 · 2.2 Percentages and Percentiles Check the specification (PDF) (opens in a new tab)
Calculate percentage increases and decreases from graphical data, such as population line graphs.
Construct histograms depicting normal and skewed distributions.
Utilize histograms to accurately calculate and interpret percentiles.
A population line graph shows how the number of people in a place changes over time. Reading two points lets us find the change in the number of people. Percentage change expresses that change relative to the starting population.
‘Percent’ means ‘out of one hundred’. A population increase of 25% means that the population has grown by 25 people for every 100 people present at the start. Percentages therefore help us compare changes in places with different starting populations: the same numerical increase can represent a large change in a small town but a small change in a large city.
First identify the period being compared. The population at the earlier date is the original value; the population at the later date is the final value.
Check the labels and scale before reading the graph. Time is usually on the horizontal axis and population on the vertical axis. Work out what each interval represents, including any smaller divisions. If population is shown in thousands, a reading of 40 means 40,000 people, not 40 people. Where several lines appear, use the key to select the correct one.
To read a value, find the required year on the horizontal axis, move vertically to the line, then horizontally to the population scale. If the point falls between labelled values, use the smaller divisions to estimate its value. A calculation based on estimated readings is also an estimate.
Suppose a town has the population pattern shown below. The plotted values are 40,000 people in 2000, 50,000 in 2010 and 45,000 in 2020.
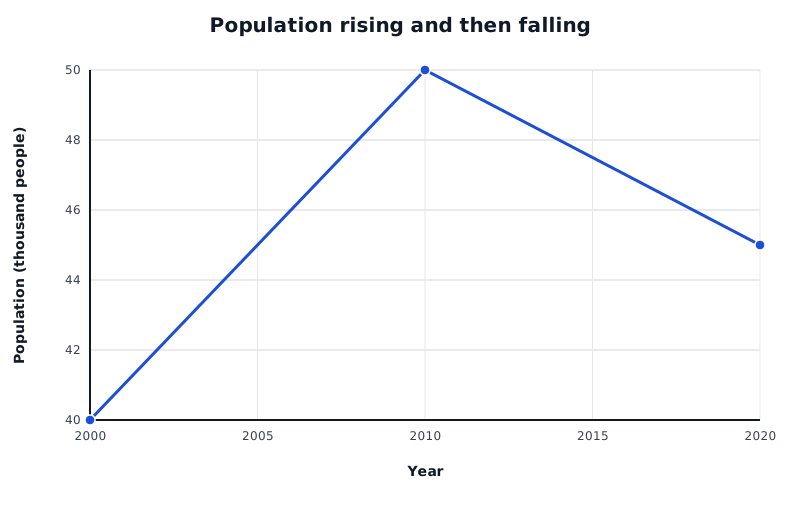
A constructed population example: read the values at the selected dates, then calculate the change relative to the starting population.
Data for Population rising and then falling
| Series | Year | Population (thousand people) |
|---|---|---|
| Town population | 2000 | 40 |
| Town population | 2010 | 50 |
| Town population | 2020 | 45 |
The calculation has three stages: find the difference, divide by the original value, then multiply by 100.
For the period 2000–2010, the graph gives an original population of 40,000 and a final population of 50,000. The increase is people.
The population increased by 25% between 2000 and 2010. Dividing by 40,000 makes the starting population the basis of the comparison. The extra 10,000 people are one-quarter of that starting population.
The same formula works when the population falls. For 2010–2020, the starting population is now 50,000, because 2010 is the beginning of this comparison. The final population is 45,000.
The negative result means that the population decreased by 10% between 2010 and 2020. A positive result indicates an increase; zero means no overall change between the two dates.
For a question about 2000–2020, compare those two endpoints directly. The population rises from 40,000 to 45,000, giving an overall increase of .
This overall increase does not mean that population rose throughout the period: the graph shows a rise followed by a fall. The line reveals the pattern, while the percentage calculation summarises the change between the selected dates.
You can calculate using 40 and 45 rather than 40,000 and 45,000 because both readings use the same thousands scale. The common scale factor divides out. What matters is that both values represent the same quantity in the same units.
State the percentage, direction and period. For a whole-period change, compare the endpoints directly; the graph may contain rises and falls between them.
Divide by the original value, not the final value or the difference.
Check the axis scale and units before reading values. Use the correct line if the graph shows several datasets.
Show the subtraction, division and multiplication by 100. Keep calculator precision until the final answer, then round as requested.
Write either ‘−10%’ or ‘a 10% decrease’; make the direction of change clear.
It can see this note and what your specification asks for.
Answers are free with an account.
1 free note left this week
Get more free notesYour answer sets when this note comes back for review, or marks it complete.
Was this note helpful?
Log in to tell us whether it helped, or to report a problem.
Last updated
Percentage change
The increase or decrease in a quantity expressed as a percentage of its original value.
Original value
The starting value used as the basis for calculating a change; in a comparison over time, this is the value at the earlier date.
Final value
The value at the end of the period being compared.
Line graph
A graph in which plotted values are joined by lines, often used to show how a quantity changes over time.
Put your knowledge into practice — try past paper questions for Geography B
Percentage change
The increase or decrease in a quantity expressed as a percentage of its original value.
Original value
The starting value used as the basis for calculating a change; in a comparison over time, this is the value at the earlier date.
Final value
The value at the end of the period being compared.
Line graph
A graph in which plotted values are joined by lines, often used to show how a quantity changes over time.