

Loading…
Loading…
Loading…
Eduqas GCSE Geography B · C112
Eduqas C112 · 1.2 Fieldwork Evidence Collection Check the specification (PDF) (opens in a new tab)
Design effective data collection sheets for fieldwork execution.
Select appropriate locations for data gathering and establish robust control groups.
Justify sample sizes and the use of random, systematic, opportunistic, and stratified sampling techniques.
Operate fieldwork equipment, such as clinometers or quadrats, to obtain accurate and reliable measurements.
Collect quantitative data measuring flow, scale, spatial patterns, and temporal changes.
Gather qualitative data using questionnaires, bi-polar techniques, and annotated photographs or sketches.
Utilize secondary sources of evidence, including satellite images, aerial and oblique photographs, large statistical databases, and Geographic Information Systems (GIS).
Geographical enquiries need evidence that answers the question being investigated. Primary data is information you collect first-hand, such as a traffic count or a slope measurement. Secondary data has already been collected by someone else, such as census statistics or an aerial photograph.
The distinction concerns who collected the information, not its format. A photograph you take during fieldwork is primary evidence; an existing photograph obtained from an archive is secondary evidence.
Quantitative data consists of counts and measurements. It helps establish how much, how large, where and when. Qualitative data describes characteristics, experiences and opinions. It can explain what a place feels like or why people use it. An enquiry into a busy shopping street might combine traffic counts with residents’ descriptions of noise and congestion.
An accurate measurement is close to the true value. Reliable results are consistent when the procedure is repeated under comparable conditions. Both depend on using suitable equipment correctly: repeated readings from a badly positioned instrument can be consistently wrong.
Before collecting data, check that the equipment works, select the correct units and practise the procedure. Keep relevant conditions consistent, such as the duration of a count or the height of a thermometer. Record the location, time, units and any unusual circumstances alongside each result. Repeat measurements where appropriate, and investigate unexpected readings rather than automatically deleting them.
Safety limits the method you can use. Work within the agreed risk assessment and teacher supervision. Avoid unstable slopes, dangerous water and exposure to traffic; obtaining a reading is never a reason to enter an unsafe location.
A clinometer measures an angle of slope in degrees. It can help investigate how steepness changes along a hillside or beach profile.
Place two ranging poles vertically at the ends of the slope section. Identify marks at the same height above the ground on both poles. Hold the clinometer at the height of the first mark and sight towards the matching mark on the second pole. Wait until the pointer or reading settles, then record the angle and the section measured. Repeat the reading to check consistency.
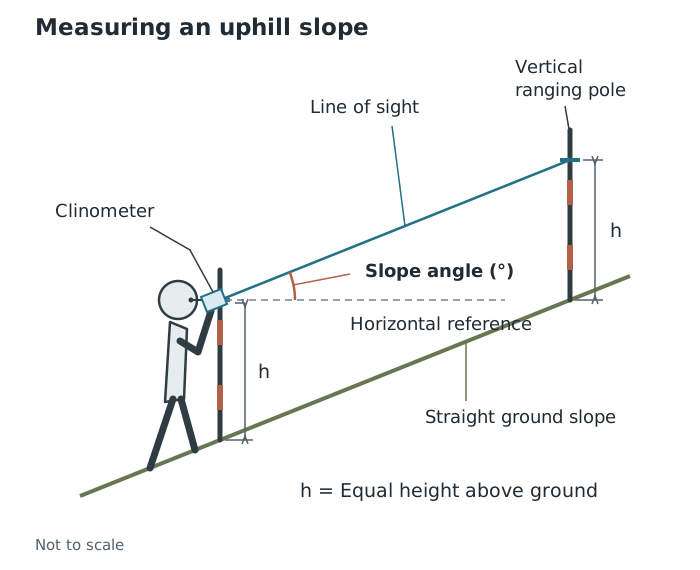
Sighting between equal-height reference marks gives the angle of the ground slope.
Equal-height marks matter because their height difference then matches the height difference between the ground positions. Sighting a higher mark on the second pole would exaggerate an uphill slope. Leaning poles or a moving pointer also introduce error. Use safe, stable positions and do not move backwards while looking through the instrument.
A quadrat encloses a known area. It allows you to count features or estimate their cover within a consistent-sized sample, rather than judging a whole site at once.
For example, an enquiry could compare vegetation cover at different distances from a footpath. Place the frame flat at each selected sampling position and use the same quadrat size throughout. Count the chosen feature or estimate the proportion of the frame it covers. A gridded quadrat helps divide the area into manageable sections.
Agree beforehand how to treat features touching the frame edge and what counts as the feature being recorded. Complete the observation only when the whole frame has been checked. Changing the counting rule between sites makes comparisons unreliable. Avoid trampling the area before recording it, handle vegetation carefully and wash hands after contact with soil.
Quantitative methods are chosen according to the geographical property being investigated.
| Property | Examples | What to collect |
|---|---|---|
| Flow: movement through a place over time | Traffic, river discharge, infiltration | Traffic passing a fixed point during a timed interval; water moving through a river cross-section; water entering the soil over time |
| Scale: size or steepness | River width, pebble size, gradient | Width measured with a tape; a consistently chosen pebble dimension; slope angle measured with a clinometer |
| Spatial pattern: variation between locations | Retail land use, sediment sorting | Land-use categories along a route; sediment sizes at different positions |
| Temporal change: variation over time | Temperature, rainfall, pressure | Repeated weather readings at recorded times |
For a traffic count, define which direction and vehicle categories are included. Use a tally counter or tally sheet for a fixed period, and stand in a safe position away from the carriageway. Stop when the agreed interval ends. Counts made for different lengths of time cannot be compared directly.
River discharge is the volume of water passing a cross-section each second, usually measured in cubic metres per second. Investigating it requires evidence about the cross-sectional area and water velocity, not just a depth reading:
To collect channel measurements, stretch a tape taut across the river at right angles to the flow and measure the width between the water’s edges. Measure depth at regular intervals across the channel using a ruler held vertically. Let it just touch the bed rather than pushing it into soft sediment, and record each depth with its position across the channel. These measurements allow the channel’s cross-sectional area to be estimated later.
A float method measures surface velocity. Mark the start and finish of a measured river section, release a visible float upstream of the start without pushing it, and time its travel between the marks. Repeat the timings. Surface velocity is not necessarily the mean velocity of the whole cross-section, so using it to estimate discharge has a limitation. A suitable flow meter can measure velocity at different positions and depths; stand beside or downstream of it so that you do not obstruct the approaching water. Follow the instrument’s instructions and wait for its prescribed recording period to finish.
River work requires particular attention to slippery surfaces, depth and current. Only enter water where the teacher’s risk assessment permits it, under supervision; do not enter deep or fast-flowing water or pursue a float into danger.
Infiltration concerns water entering the soil. Investigating this flow requires recording water entering the ground over time, rather than simply describing whether the soil looks wet. Comparisons need the same test procedure at each site.
For scale measurements, specify exactly what is being measured. To measure pebble size, use a ruler or callipers to measure the longest axis and record it in a consistent unit, such as millimetres. Measuring different axes at different sites would introduce a method difference rather than reveal a geographical difference.
For spatial patterns, attach a location to every observation. Retail land-use categories become quantitative evidence when shops are counted along a transect—a line or route across an area. To investigate sediment sorting, collect pebble-size measurements at recorded positions across a river channel or sediment deposit. Differences in the sizes found at those positions reveal the spatial pattern.
For temporal change, measure at consistent intervals and retain the dates and times. Temperature is recorded in °C, rainfall in millimetres and atmospheric pressure commonly in hectopascals. Keep instrument positions and recording periods consistent. Allow a thermometer reading to stabilise and keep its sensor away from your hands or breath. Otherwise, apparent change might result from the measurement procedure rather than the weather. Rainfall totals must cover comparable lengths of time, while temperature and pressure readings need their observation times recorded.
A questionnaire collects answers to a standard set of questions. Closed questions provide fixed choices that can be counted; open questions invite descriptions and explanations. Thus, one questionnaire can generate both quantitative and qualitative evidence.
For an enquiry about a shopping street, “What is your main reason for visiting?” could use fixed categories, while “What would improve this street?” could invite an open answer. Use clear, neutral wording, ask questions consistently and record answers faithfully. Explain the purpose, seek voluntary participation and avoid unnecessary personal information. Stop if someone declines or wishes to leave.
A bi-polar assessment places contrasting descriptions at opposite ends of a scale. For example, a cleanliness scale could run from −2 for very dirty, through −1 for somewhat dirty, 0 for neither clean nor dirty, and +1 for somewhat clean, to +2 for very clean. Assess each characteristic separately, using the same descriptors and scoring direction at every site. Other pairs might include noisy–quiet or dangerous–safe for pedestrians.
These scores remain subjective because observers make judgements. Agreeing descriptions for each score and comparing observers’ assessments can reduce differences, but cannot make the judgements completely objective. Several observers can score independently and compare their assessments, or discuss the evidence before agreeing a score. An environmental-quality assessment can therefore be useful for comparing places while still requiring cautious interpretation.
A photograph records visible conditions; an annotated photograph explains which features matter to the enquiry. A field sketch is a selective drawing of relevant features, not an artwork.
Record the location, date and direction of view. Select a viewpoint that shows the features being investigated, then add labels linked to specific details. For a street enquiry, annotations might identify pedestrian space, traffic, shop frontages or visible litter. An explanatory annotation goes beyond naming a feature: “bollards restrict vehicle access to this pedestrian space” links an observed feature to its function. Separate observation from interpretation: “litter beside the bench” is visible evidence; “people do not care about this place” is an unsupported explanation.
Keep a sketch simple, showing the relative positions and sizes of the relevant features. Keep the framing and viewpoint consistent when comparing photographs over time. Complete the record when the relevant features and identifying details have been captured. Take images from safe positions, respect privacy and follow the agreed permission rules.
Secondary evidence can provide a wider view, a longer record or information that cannot be collected during a short visit.
When examining an image, first establish its date, location and viewing angle. Identify visible features relevant to the enquiry, such as buildings, roads or vegetation, and examine how they are arranged. An image records visible conditions at a particular time; it does not directly reveal residents’ opinions or prove why a change occurred. Comparing images from different dates can reveal change, but seasonal differences or different viewpoints may complicate the comparison.
For a database enquiry, select the relevant geographical area, variable and year. For example, census population information can provide context for questionnaire findings. Check the geographical boundaries and definitions: a statistic for a whole council area may not describe the particular street investigated, and population data alone cannot establish what its residents think.
A Geographic Information System (GIS) stores, displays and analyses information linked to locations. Systems used by the Environment Agency are examples. Different layers, such as buildings, roads and flood risk, can be displayed together to investigate spatial relationships.
Suppose an enquiry asks whether buildings are exposed to flooding. Compare a building-location layer with a flood-risk layer. First read the key to establish what each risk category means, check the map date and zoom to a useful scale. Switch the layers on together and identify where building locations overlap the mapped risk areas.
For a simple constructed example, suppose the building layer contains a school, a shop and a library. The flood-risk layer overlaps the school and shop but not the library. The overlap identifies the school and shop as priorities for further investigation of flood exposure and protection. It does not prove that either building has flooded, or that the library has no flood risk from other sources.
Transfer this approach to an authentic GIS map by using its own legend, metadata and layer definitions. Do not assume that colours have the same meaning in different systems. A regional map may be too general to support conclusions about an individual property. GIS can combine evidence efficiently, but its conclusions depend on the quality, date and detail of the underlying layers.
Assess secondary evidence before using it. Who produced it, and how was it collected? Does it answer the enquiry question? Is its date appropriate, and is its geographical detail sufficient? Historical evidence is useful for investigating change, even though it is not current.
Comparison also requires compatible measurements. A brief weekday traffic count cannot directly establish agreement with an annual average covering all days. Differences might reflect timing or method rather than an error in either dataset.
Combining methods can strengthen an enquiry. Traffic counts might establish that one street is busier, questionnaires might explain people’s experience of it, and published traffic data might show whether the visit was typical. Agreement supports confidence in a conclusion; disagreement is a reason to investigate dates, coverage, definitions and bias. The strongest choice is not the method that produces the most information, but the combination that answers the question safely and convincingly.
Justify a method by linking what it measures to the enquiry question, then explain how you would keep the procedure consistent.
Repeating a measurement does not remove a consistent error, such as sighting the wrong height with a clinometer.
A numerical environmental-quality score can still be subjective: the number represents a judgement, not an objective instrument reading.
When comparing primary and secondary data, check that their locations, dates, units and measurement periods are comparable.
It can see this note and what your specification asks for.
Answers are free with an account.
1 free note left this week
Get more free notesYour answer sets when this note comes back for review, or marks it complete.
Was this note helpful?
Log in to tell us whether it helped, or to report a problem.
Last updated
Primary data
Information collected first-hand by the person or group carrying out an enquiry.
Secondary data
Information already collected by someone else and used as evidence in an enquiry.
Quantitative data
Numerical information obtained through counting or measurement.
Qualitative data
Descriptive information about characteristics, experiences, opinions or meanings.
Accuracy
How close a measurement is to the true value.
Reliability
The consistency of results when a method is repeated under comparable conditions.
Clinometer
An instrument used to measure an angle of slope, usually in degrees.
Quadrat
A frame enclosing a known area, used to sample the objects or features within it.
Bi-polar scale
An assessment scale with contrasting descriptions at its two ends, such as very dirty and very clean.
Discharge
The volume of water passing through a river cross-section per unit time, usually measured in cubic metres per second.
Geographic Information System (GIS)
A computer system used to store, display and analyse information linked to geographical locations.
Put your knowledge into practice — try past paper questions for Geography B
Primary data
Information collected first-hand by the person or group carrying out an enquiry.
Secondary data
Information already collected by someone else and used as evidence in an enquiry.
Quantitative data
Numerical information obtained through counting or measurement.
Qualitative data
Descriptive information about characteristics, experiences, opinions or meanings.
Accuracy
How close a measurement is to the true value.
Reliability
The consistency of results when a method is repeated under comparable conditions.
Clinometer
An instrument used to measure an angle of slope, usually in degrees.
Quadrat
A frame enclosing a known area, used to sample the objects or features within it.
Bi-polar scale
An assessment scale with contrasting descriptions at its two ends, such as very dirty and very clean.
Discharge
The volume of water passing through a river cross-section per unit time, usually measured in cubic metres per second.
Geographic Information System (GIS)
A computer system used to store, display and analyse information linked to geographical locations.
A timed float measures surface velocity, not necessarily the mean velocity of the whole cross-section.
Use satellite images, aerial and oblique photographs, National Statistics and GIS.
Check producer and method, relevance, date, scale and comparability. Combine evidence to explain, support or challenge primary findings—not simply to assume they are correct.