

Loading…
Loading…
Loading…
Eduqas GCSE Geography B · C112
Eduqas C112 · Table A Fieldwork Methodologies Check the specification (PDF) (opens in a new tab)
Apply transect methodologies to assess variables such as environmental quality, micro-climates, river flow patterns, vegetation distribution, or beach sediment sorting.
Analyze change over time by comparing primary fieldwork data with secondary sources to investigate shifting land uses, weather, or physical landforms.
Conduct qualitative surveys to evaluate public perception of distinct landscapes, environmental quality, hazard risks, or specific honeypot sites.
Measure and analyze geographical flows, such as soil infiltration rates, pedestrian movements, river discharge rates, or longshore drift.
A transect is a line across an area along which observations or measurements are made. It helps answer questions about spatial change: how does something differ from one location to another?
For example, a route across a town could reveal changes in environmental quality, while a line from the lower to the upper beach could reveal changes in slope and sediment size. Recording distance along the line connects each result to its position. Without location information, a collection of measurements cannot show where change occurs.
The route should cross the contrasts relevant to the enquiry. A beach-profile transect runs across the beach rather than along the coastline. A vegetation transect could cross a sand dune system or run from the edge into woodland. An urban transect should include the different areas being compared, rather than just the easiest streets to visit.
It is usually impractical to measure every point along a route. Systematic sampling means collecting data at regular intervals: for example, every 20 metres. This gives an ordered sequence of sites and reduces the temptation to select only locations that support an expected pattern. However, features between the sampling points may be missed.
Before setting out, mark the route and sampling sites on a map, check access and complete a risk assessment. Prepare a recording sheet with columns for site, distance, measurements, units and relevant observations. Practise using the equipment and check that it works.
At each site, use the same procedure. Keep equipment, scoring criteria and measurement heights consistent where relevant. Repeated readings help reveal whether an unusual result is a persistent feature or a measurement problem. Record any site moved for safety or access reasons, because its position affects the interpretation.
Finish when the planned route and sampling sites have been covered, the required readings have been recorded and the sheets have been checked for missing values or units—not simply when a convincing-looking pattern appears.
An environmental quality survey assesses conditions using a consistent set of indicators. These might include litter, noise and building condition. Each indicator can be scored using a bipolar scale, such as −3 for very poor conditions through 0 to +3 for very good conditions. Define what the scores mean before collecting data, then use those definitions at every site.
Although the results are numbers, they are based on judgement. Several students can assess each site and agree a score, or their separate scores can be compared using the mode. This makes differences between observers easier to identify and reduces dependence on one person's opinion.
Suppose students assess three indicators at five sites, each 100 metres apart. Each indicator uses the same −3 to +3 scale, giving a possible total from −9 to +9. Their totals are −6, −3, 0, +2 and +6. Plotting the totals against distance makes the spatial pattern visible.
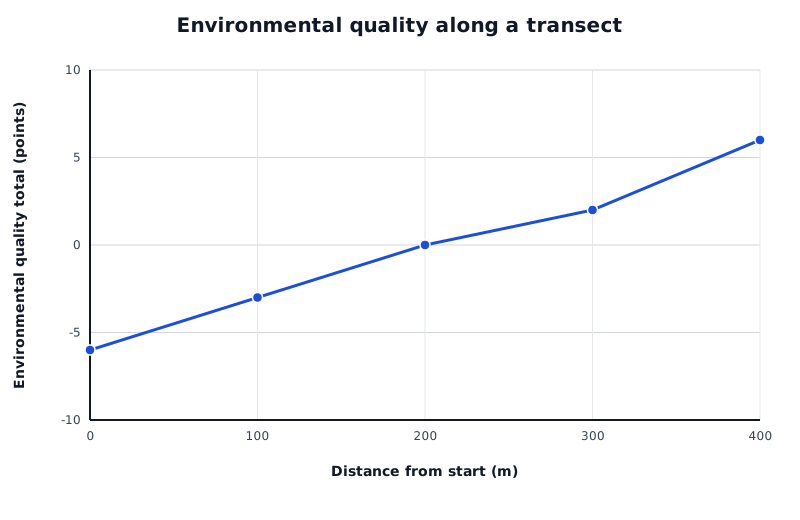
A constructed example: environmental quality totals increase along this route. The points represent sampled sites, not every location between them.
Data for Environmental quality along a transect
| Series | Distance from start (m) | Environmental quality total (points) |
|---|---|---|
| Environmental quality total | 0 | -6 |
| Environmental quality total | 100 | -3 |
| Environmental quality total | 200 | 0 |
| Environmental quality total | 300 | 2 |
| Environmental quality total | 400 | 6 |
In this example, the total rises by 12 points between the first and last sites, suggesting improving environmental quality along the route. The individual indicator scores would show whether the improvement involved less litter, less noise, better building condition or a combination. The pattern does not establish its cause, and conditions elsewhere in the town may differ.
Quality of life is broader than environmental appearance. A pleasant-looking street alone does not establish that residents have a high quality of life; an enquiry must select evidence relevant to the particular aspect being investigated.
A microclimate is the atmospheric conditions in a small area. A transect can compare air temperature and wind speed across a town or up a slope. Use a thermometer for temperature and an anemometer for wind speed, recording the units used by each instrument.
Record the surroundings too: shade, ground material, nearby buildings and vegetation may help explain differences. Buildings can shelter a site from wind or funnel wind through gaps. Surface material and colour can affect surface temperature. Air temperature and surface temperature are different measurements, so they should be recorded separately.
Keep the measurement procedure consistent and collect readings as close together in time as practical. Otherwise, a change in weather during the survey could be mistaken for a difference between locations. An open site can provide a useful comparison with sheltered sites near buildings.
Plot each weather variable against distance and examine where values rise or fall. Compare those positions with the recorded surroundings, while recognising that several factors may influence the same reading.
A vegetation transect investigates changes in the distribution of plants across a dune system or through woodland. A quadrat is a frame enclosing a known area. It gives each vegetation sample a defined boundary, so comparisons are not based on differently sized patches.
For a dune survey, begin at the strandline, the mark of a high tide often identifiable by deposited seaweed and debris. Mark the start with a pole, lay a measuring tape along a straight line into the dunes and mark the endpoint with another pole. Record the location, date, weather and total transect length.
Choose sample positions before assessing the vegetation. You could place quadrats at regular distances, such as every 5 metres, or use randomly selected distances along the line. Systematic positions make changes along the route easy to follow; random positions reduce deliberate selection of particular patches. Use the same quadrat size and place it consistently relative to the tape at every selected point.
At each quadrat:
For example, a quadrat 5 metres from the strandline could contain 95% bare sand, 3% sea rocket and 2% sea sandwort. It contains two plant species: their percentage cover describes how much area they occupy, while the species count describes how many different species are present.
Keep identification and cover-estimation procedures consistent, and check uncertain identifications together. Avoid damaging plants or trampling sensitive habitats, and follow the approved route.
Plot each species' percentage cover against distance to see where its distribution changes. You can also calculate its mean percentage cover within each dune habitat by adding its cover values and dividing by the number of quadrats sampled in that habitat, including quadrats where it was absent as zero. Compare these patterns with soil and habitat observations to suggest explanations. The same quadrat approach can investigate ground vegetation from a woodland edge into its interior, with distance measured from the woodland starting point rather than a strandline.
A river transect crosses the channel rather than following the river downstream. Measurements at positions across the same section allow patterns in flow and deposited material to be compared.
Use only a teacher-approved site and procedure following a risk assessment of water depth, current, weather and bank conditions. Wet or steep banks can be slippery. Wear suitable footwear and work under supervision; do not enter water where you could be knocked off your feet or where a fall could leave you needing to swim. Unsafe sites must be changed or abandoned, not surveyed to complete a sampling plan.
Stretch a tape measure across the channel at right angles to the flow. Record the width and establish measurement stations at regular intervals, for example every 30–50 centimetres depending on channel size. Distance from one bank locates every reading.
At each station, measure water depth with a ruler or ranging pole. Let it just touch the bed rather than push into soft sediment, and keep its narrow edge facing upstream to reduce resistance. Record unusual features such as boulders. These readings can be plotted as a channel cross-section, but depth alone does not measure flow speed.
To investigate flow speed, use a flow meter according to its operating instructions. Measure at the selected distances across the channel, keeping measurement depth consistent where possible and recording it. Readings at additional depths can investigate vertical differences. Measure over a consistent period, such as one minute, and repeat readings to obtain a mean. Stand beside or downstream of the meter so your body does not obstruct the approaching water. Record velocity in metres per second.
At the same stations, where safe access permits, sample deposited bed material. A consistent pebble-selection procedure is to extend an index finger and select the first pebble it touches rather than choose a conspicuous stone. Measure its longest axis with a ruler or callipers and record the size in millimetres. Repeat for the same number of pebbles at each station, for example ten, and record the distance from the bank. A roundness chart can also be used consistently if shape is part of the enquiry.
Plot mean velocity and representative sediment size against distance from the bank, using separate graphs where units differ. Compare where faster or slower flow occurs with the channel shape and deposited material. The sampled bed material records what is present; it does not directly measure the current rate of deposition. A single survey can reveal spatial associations, but cannot establish that present flow alone produced the deposits.
A beach transect can investigate both the profile of the beach and changes in sediment size from its lower to upper parts. These are related observations, but they measure different things: slope measurements describe shape, while sediment measurements describe the material.
For a profile, start at a safe point above the water's edge and work up the beach. Place two ranging poles at successive breaks of slope. Measure the distance between them with a tape measure and use a clinometer to measure the angle between matching-height marks on the poles. Keep the poles upright. Matching marks prevent unequal sighting heights from distorting the slope reading.
Move the poles to the next segment and repeat until the top of the beach is reached. Recording each segment captures changes in gradient that one overall slope reading would conceal.
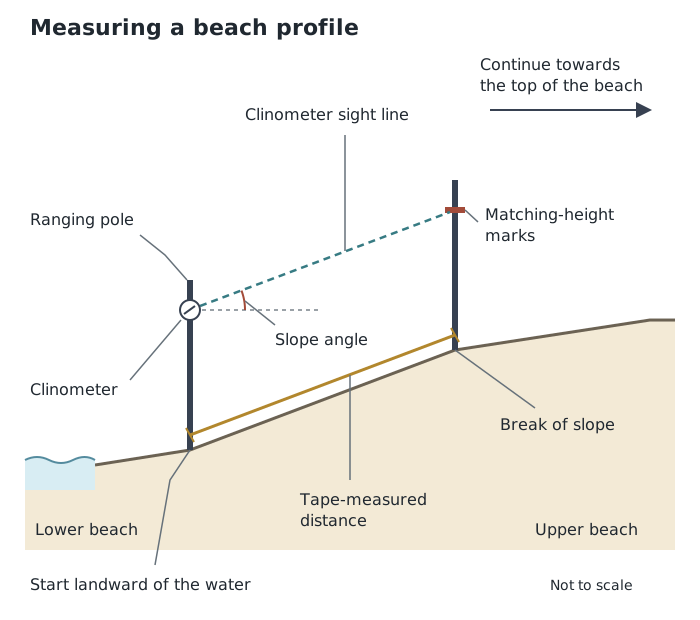
Measure each segment between breaks of slope, then continue up the beach. Upright poles and matching-height marks keep the angle measurement consistent.
At selected positions along the same transect, collect a consistently selected sample of sediment. For pebbles, callipers can measure size; use the same dimension for every pebble and record it in millimetres. Compare representative sizes between sites to identify sorting. Measuring only the largest or most noticeable stones would give a misleading picture.
A graph of sediment size against distance can show whether material becomes larger, smaller or varies without a simple trend. Do not assume a particular pattern before collecting the evidence.
Check the tide times and weather, maintain a safe distance from waves and do not enter the sea. Use designated access paths, avoid unstable cliffs and do not climb coastal defences. Wear gloves when handling pebbles and do not handle beach litter.
Distance along the transect usually belongs on the horizontal axis of a graph; the measured variable belongs on the vertical axis, with units where appropriate. Describe the overall pattern, support it with values and identify exceptions. Connecting sampled points helps show the sequence, but does not reveal the actual conditions at every unsampled point.
Then use the recorded surroundings and geographical processes to suggest explanations. A single transect provides evidence about one route. Repeating it along additional routes helps test whether its pattern is more widespread.
Explain why the transect crosses the change you want to investigate; a line chosen only because it is easy to access may miss important contrasts.
Distinguish the transect route from the sampling strategy: systematic sampling means taking observations at regular intervals along that route.
When describing a method, include the equipment, sampling locations, measurements, units and steps that keep results comparable.
Support a conclusion with values and locations. A spatial association does not, by itself, prove a cause.
Link each safety precaution to a hazard, such as checking tide times to avoid being cut off by rising water.
It can see this note and what your specification asks for.
Answers are free with an account.
1 free note left this week
Get more free notesYour answer sets when this note comes back for review, or marks it complete.
Was this note helpful?
Log in to tell us whether it helped, or to report a problem.
Last updated
Transect
A line across an area along which observations or measurements are made to investigate spatial change.
Systematic sampling
Collecting observations at regular intervals, such as every 20 metres along a transect.
Spatial pattern
The arrangement of features or values across an area.
Environmental quality survey
An assessment of conditions at a location using indicators such as litter, noise and the condition of buildings, often recorded as numerical scores.
Microclimate
The atmospheric conditions in a small area, which may differ from those of its surroundings.
Quadrat
A frame enclosing a known area, used to sample features such as vegetation.
Percentage cover
The proportion of a sampled area covered by a particular feature, such as a plant species, expressed as a percentage.
Flow meter
An instrument used to measure the speed of flowing water.
Beach profile
A cross-section showing how the height and slope of a beach change across its width.
Clinometer
An instrument used to measure an angle of slope.
Sediment sorting
The separation of sediment into different sizes in different locations.
Put your knowledge into practice — try past paper questions for Geography B
Transect
A line across an area along which observations or measurements are made to investigate spatial change.
Systematic sampling
Collecting observations at regular intervals, such as every 20 metres along a transect.
Spatial pattern
The arrangement of features or values across an area.
Environmental quality survey
An assessment of conditions at a location using indicators such as litter, noise and the condition of buildings, often recorded as numerical scores.
Microclimate
The atmospheric conditions in a small area, which may differ from those of its surroundings.
Quadrat
A frame enclosing a known area, used to sample features such as vegetation.
Percentage cover
The proportion of a sampled area covered by a particular feature, such as a plant species, expressed as a percentage.
Flow meter
An instrument used to measure the speed of flowing water.
Beach profile
A cross-section showing how the height and slope of a beach change across its width.
Clinometer
An instrument used to measure an angle of slope.
Sediment sorting
The separation of sediment into different sizes in different locations.
Plot the variable against distance. Identify trends, quote values and note exceptions. Explain patterns using contextual observations, without assuming that association proves causation.
Regular intervals can miss features between sites. One route may not represent the whole area; repeat transects to test wider patterns.
Risk-assess the route. Stay with the group, use safe road crossings, avoid hazardous river access and check tides before beach work. Do not enter the sea. Stop or change the survey if conditions become unsafe.