

Loading…
Loading…
Loading…
Eduqas GCSE Geography B · C112
Eduqas C112 · Table A Fieldwork Methodologies Check the specification (PDF) (opens in a new tab)
Apply transect methodologies to assess variables such as environmental quality, micro-climates, river flow patterns, vegetation distribution, or beach sediment sorting.
Analyze change over time by comparing primary fieldwork data with secondary sources to investigate shifting land uses, weather, or physical landforms.
Conduct qualitative surveys to evaluate public perception of distinct landscapes, environmental quality, hazard risks, or specific honeypot sites.
Measure and analyze geographical flows, such as soil infiltration rates, pedestrian movements, river discharge rates, or longshore drift.
A geographical flow is movement between places: water entering soil, a river carrying water downstream, commuters travelling to work or sediment moving along a coast. Fieldwork investigates how much moves, how quickly it moves and where it goes.
These are different questions. Counting people measures the quantity passing a point; timing a river float estimates speed; measuring river discharge estimates the volume passing a point each second. A rate expresses an amount per unit of time, allowing results from different observations to be compared.
An enquiry needs a clear comparison, such as ‘Does infiltration differ between heavily used and less-used ground?’ or ‘How do pedestrian flows towards a station change during the day?’ Measurements you collect are primary data. Rainfall records or existing transport statistics can provide secondary data to help explain your results.
Infiltration is water entering the soil from the surface. To compare infiltration at different sites, use an open-ended cylinder, often called an infiltration ring, inserted into the ground. The ring confines the water to a known area while you observe how quickly it enters the soil.
Choose sites representing the ground conditions being compared. At each site, insert the same ring to the same depth, avoiding large gaps around its edge. Add water to a marked starting level, start a stopwatch and time how long the water takes to fall to a second mark. The reading is complete when the surface reaches that lower mark.
Keep the fall in water level the same at every site. Record the fall in millimetres and the time in minutes:
Suppose the water level falls by 20 mm in 4 minutes at one site. Its average infiltration rate over that interval is mm/min. If the same fall takes 10 minutes elsewhere, the rate is 2 mm/min. The first site absorbs water more quickly under the conditions tested.
Repeat at several points within each ground type and calculate mean rates. A bar chart can compare these means. Record recent rainfall, vegetation and signs of trampling: differences may reflect several factors, not simply the soil type. A single reading cannot represent an entire field, and water escaping through gaps beside the ring would make absorption appear faster.
Obtain permission before inserting equipment, check for buried services and avoid sharp cylinder edges. Use suitable footwear, wash hands after handling soil and leave the site safe when finished.
Interception occurs when vegetation catches precipitation before it reaches the ground. Compare identical rain gauges beneath a canopy with a control gauge in the open. The open gauge measures rainfall without the canopy above it; gauges beneath vegetation measure rainfall reaching those positions through the canopy.
Set the gauges upright and collect readings over the same rainfall event and time interval. Use several positions beneath the canopy because water may drip unevenly from leaves and branches. Repeat for different vegetation types or rainfall events, keeping gauge design and collection periods consistent.
Suppose an open gauge collects 12 mm and the mean beneath a canopy is 8 mm during the same period. The difference is 4 mm. This suggests that less rainfall reached the sampled ground beneath the vegetation.
Do not treat this difference as an exact measurement of all intercepted water: some water travels down stems and trunks, and some may drip later. Record when readings were taken. Little or no rain may leave too little data for a useful comparison. Place equipment where it will not create a trip hazard, and avoid working beneath trees during storms.
River discharge is the volume of water passing a point each second. A wide river does not necessarily have a high discharge: depth and velocity matter too. Calculate discharge by combining the area occupied by water with its mean velocity:
Here, is discharge in m³/s, is cross-sectional area in m² and is mean velocity in m/s.
First, stretch a tape across the channel at right angles to the flow and measure the water-surface width. Measure depth with a ruler at regular intervals across that width. Hold the ruler upright, with its narrow edge facing upstream, and let it just touch the bed rather than pushing it into soft sediment. These readings show the channel's shape and allow an estimate of its area:
Next, measure velocity. Mark a known distance along the river and release a visible float upstream of the starting line without pushing it. Start timing when it crosses the first line and stop when it crosses the finishing line:
Repeat the timings. A float measures surface velocity, not the mean velocity throughout the water: friction against the bed and banks slows water. A flow meter can provide readings at different positions and depths; follow its operating instructions and stand beside or downstream of it to avoid disturbing the approaching flow.
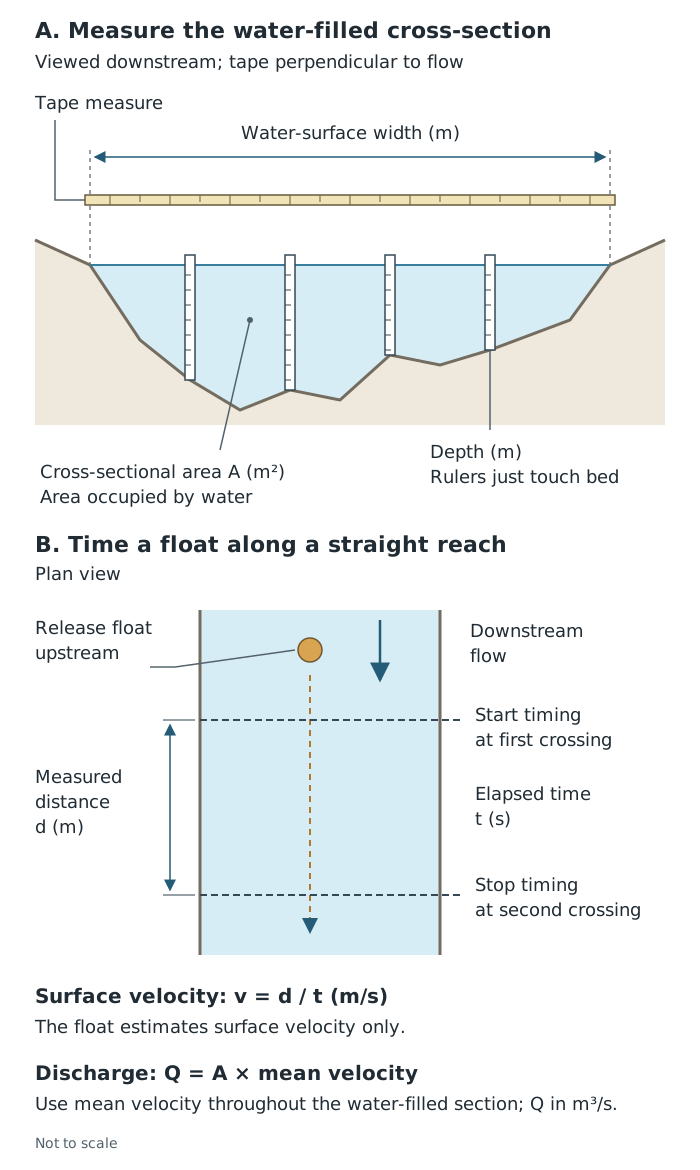
Discharge combines the river's water-filled cross-sectional area with mean velocity. A float provides only a surface-velocity estimate.
For a constructed example, suppose a river is 3 m wide, has a mean depth of 0.4 m and a measured mean velocity of 0.5 m/s. Its estimated cross-sectional area is m², giving a discharge of m³/s. This means an estimated 0.6 cubic metres of water passes the measurement point each second.
In a river split into several channels, measure each channel and add their discharges. Water moving unseen through bed sediment may not be included, so the measured surface-channel total can underestimate the overall flow.
River fieldwork requires a risk assessment and supervision. Avoid deep, fast-flowing water, unstable banks and conditions following heavy rain. Use approved footwear and equipment; do not enter an unsafe channel or chase a lost float. An alternative site or a bank-based method is better than taking a risk.
To investigate the relationship between rainfall and discharge, obtain rainfall totals for known periods and discharge measurements with recorded dates and times. Check that the rain gauge or rainfall record is relevant to the river's drainage basin: rain falling elsewhere may not explain its flow.
Compare the timing and size of rainfall events with changes in discharge. A time-series graph can show whether discharge rises after rainfall and whether the response is immediate or delayed. Keep the units clear: rainfall depth in millimetres is not the same quantity as discharge in m³/s.
Look for an overall relationship and exceptions. Interception and infiltration mean that not all rainfall immediately enters a channel. A single discharge measurement may miss the highest flow, while water abstraction or diversions may affect the result. Explain the pattern using the evidence rather than assuming that every rainfall event produces the same response.
A pedestrian or traffic count records movement past a defined point during a fixed period. Choose safe observation points, decide exactly which line people or vehicles must cross to be counted, and use a tally sheet. Record opposite directions separately if direction matters. For traffic, agreed categories such as cars, buses and cycles allow comparisons between transport types.
Use equal counting periods at different sites. Where possible, count simultaneously; otherwise a difference could reflect changing time rather than location. Repeat at agreed times, such as a weekday morning and the middle of the day, and record weather and unusual events.
Suppose 60 people cross a counting line in 10 minutes. The observed rate is people per minute. Multiplying by 60 gives an equivalent rate of 360 people per hour, but it does not show that 360 people actually passed during a whole hour: the short period may have been unusually busy.
Bar charts can compare flows between sites or times, while separate directional totals reveal the balance of movement. A large morning flow towards a station could be consistent with commuting, but a count alone does not establish journey purpose. A short, voluntary questionnaire asking about journey purpose, origin, destination and transport mode can help distinguish commuters from other travellers. Avoid identifying information and recognise that people willing to stop may differ from those who refuse.
Count from pavements or other safe spaces, never from the carriageway. Work in pairs where required, do not obstruct pedestrians and do not approach moving vehicles.
Longshore drift moves sediment along a coastline. When waves approach at an angle, swash carries material diagonally up the beach; backwash carries it down the slope. Repeated movement produces transport along the shore.
One enquiry can compare sediment size and shape at sites along the coastline. Use a consistent sampling method and the same sample size at each site. For example, select pebbles at predetermined sampling points rather than choosing the largest or most attractive ones. Measure each pebble's longest axis with a ruler or callipers, using the same unit throughout, and classify its roundness using the same chart.
Compare mean sizes and the proportions in each roundness category. Plot these against distance along the coast to identify patterns. Smaller or rounder sediment may be consistent with transport, abrasion and sorting, but local sediment sources and coastal structures may also affect it. The pattern is evidence to interpret, not automatic proof of a transport direction.
Tracking marked sediment over a known period can provide more direct evidence of movement. A float can indicate the direction of water movement, but it does not necessarily follow the same path as beach sediment. Any tracking must be permitted and avoid leaving material or litter behind.
Check tides, weather and wave conditions before coastal work. Stay away from unstable cliffs and powerful waves, maintain a safe route off the beach and never enter the sea to recover equipment.
A useful conclusion answers the enquiry using quantities: which location had the higher rate, by how much, and how consistently? Examine repeated readings as well as averages. Large variation within one site weakens confidence that a small difference between site means is meaningful.
Evaluate the method by separating random variation from systematic limitations. More repeats help with inconsistent float timings, but they do not turn surface velocity into mean velocity. Longer pedestrian counts improve coverage, but journey-purpose data are still needed to identify commuters. Choose improvements that address the actual weakness in the evidence.
Describe enough detail for someone to repeat your method: equipment, locations, timing, units, sampling and repeats.
Keep velocity and discharge distinct: velocity is measured in m/s; discharge is measured in m³/s.
Link each limitation to its effect and a realistic improvement. A float measures surface velocity, so repeat timings reduce random error but do not remove this limitation.
Explain why comparisons are fair, rather than simply saying that variables were controlled.
A pedestrian count does not identify commuters, and sediment size alone does not prove the direction of longshore drift.
It can see this note and what your specification asks for.
Answers are free with an account.
1 free note left this week
Get more free notesYour answer sets when this note comes back for review, or marks it complete.
Was this note helpful?
Log in to tell us whether it helped, or to report a problem.
Last updated
Geographical flow
The movement of water, people, vehicles or material between places, which can be investigated through its direction, quantity and rate.
Rate
The quantity moving, or the amount of change occurring, per unit of time.
Infiltration
The movement of water from the ground surface into the soil.
Interception
The capture and temporary storage of precipitation by vegetation before it reaches the ground.
Velocity
The speed of water movement in a specified direction, usually measured in metres per second in river fieldwork.
Discharge
The volume of water passing a particular point in a river per second, measured in cubic metres per second.
Cross-sectional area
The area occupied by water in a slice across a river channel, measured in square metres.
Commuting
A regular journey between home and a place of work.
Longshore drift
The movement of sediment along a coast as waves approach at an angle, producing angled swash and backwash down the beach.
Put your knowledge into practice — try past paper questions for Geography B
Geographical flow
The movement of water, people, vehicles or material between places, which can be investigated through its direction, quantity and rate.
Rate
The quantity moving, or the amount of change occurring, per unit of time.
Infiltration
The movement of water from the ground surface into the soil.
Interception
The capture and temporary storage of precipitation by vegetation before it reaches the ground.
Velocity
The speed of water movement in a specified direction, usually measured in metres per second in river fieldwork.
Discharge
The volume of water passing a particular point in a river per second, measured in cubic metres per second.
Cross-sectional area
The area occupied by water in a slice across a river channel, measured in square metres.
Commuting
A regular journey between home and a place of work.
Longshore drift
The movement of sediment along a coast as waves approach at an angle, producing angled swash and backwash down the beach.
Use numerical comparisons, check variation and anomalies, and link limitations to their effects. Repeats reduce random error; they do not remove every systematic limitation.