

Loading…
Loading…
Loading…
Eduqas GCSE Geography A · C111
Eduqas C111 · Graphical Skills Check the specification (PDF) (opens in a new tab)
A population pyramid shows who makes up a population. A choropleth map shows how a value varies between areas. A flow-line map shows movement between places and its size. Interpreting them means reading their values accurately, identifying patterns and using the evidence to reach a geographical conclusion.
Start with the title and date: what is being shown, where, and when? Then check the axes or key and the units. The same colour or bar length can mean very different things on different diagrams.
A population pyramid shows a population divided by age and sex. Age groups run up the vertical axis, normally with the youngest at the bottom. Horizontal bars extend to either side, commonly males on the left and females on the right; check the labels rather than assuming this arrangement.
Each bar represents one sex within one age group. Its length shows either an absolute figure, meaning the actual number of people, or a percentage. Longer bars mean more people or a larger share of the population. Read the horizontal scale outwards from the centre on each side.
Suppose a town has 1,000 residents, divided into the groups shown below. The two pyramids represent exactly the same population, but one uses numbers and the other percentages of all residents.
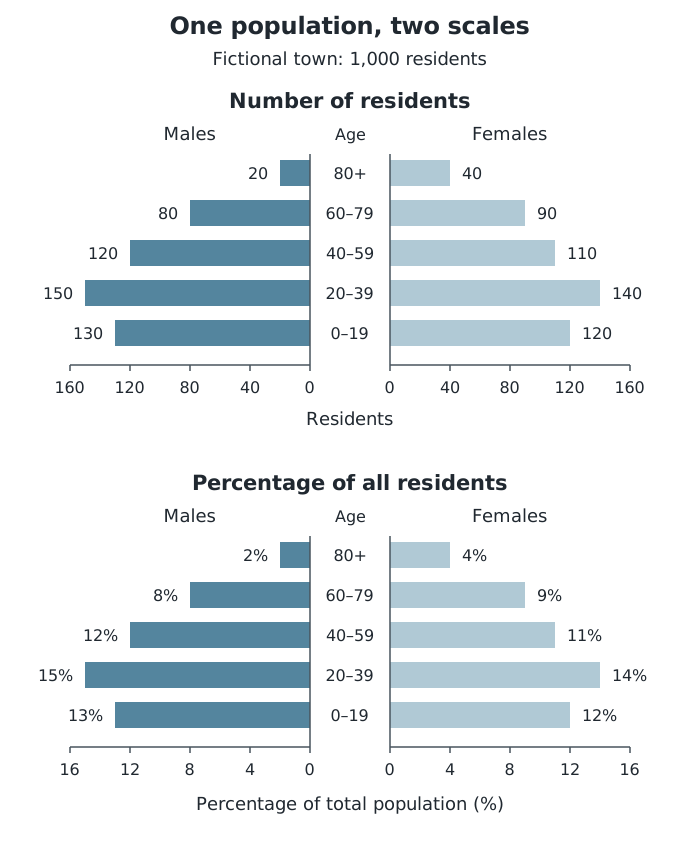
The same fictional population shown as numbers and percentages of all 1,000 residents.
There are 150 males and 140 females aged 20–39, making 290 people altogether. Since the town has 1,000 residents, this group represents 29% of its population. On the percentage pyramid, the two bars read 15% and 14%, which also total 29%.
Absolute figures are useful for judging the number of people who may need a service. Percentages are useful for comparing population structures where places have different total populations. A large country can have more older people than a small country but a smaller percentage of older people. Before comparing pyramids, check that their age groups, units and percentage bases match.
Look at the whole shape before selecting individual bars. Compare the youngest groups, the middle age groups and the oldest groups, then look for differences between males and females.
A broad base shows a large younger population. This can suggest relatively high recent birth rates. A narrower base than the groups above it shows that younger groups are smaller, which may suggest declining births. A substantial older population suggests that many people survive to older ages and is consistent with higher life expectancy.
Bulges and gaps show unusually large or small age groups. Birth rates, deaths and migration can all affect these shapes: for example, migration of working-age adults may enlarge the middle of a pyramid. However, a pyramid alone does not prove which process caused a particular bulge.
Connect an observation to its possible significance. A large younger population may create demand for schools; a large older population may increase demand for healthcare and care services. These are reasoned implications, not services directly measured by the pyramid.
A choropleth map uses shading or colour within defined boundaries to represent a variable. Each shade usually represents a range of values. Variables might include population density, life expectancy or an indicator of economic development such as income.
Read the key first, including the units and the boundaries between categories. A shaded area normally tells you its value range, not its exact value. The darkest shade is not automatically the ‘best’ or ‘worst’: its meaning depends on the variable and the key.
The next figure uses fictional districts to demonstrate reading shading categories and commuter flows. The income panel lists colour assignments rather than geographic positions; the income values and commuter movements are separate datasets.
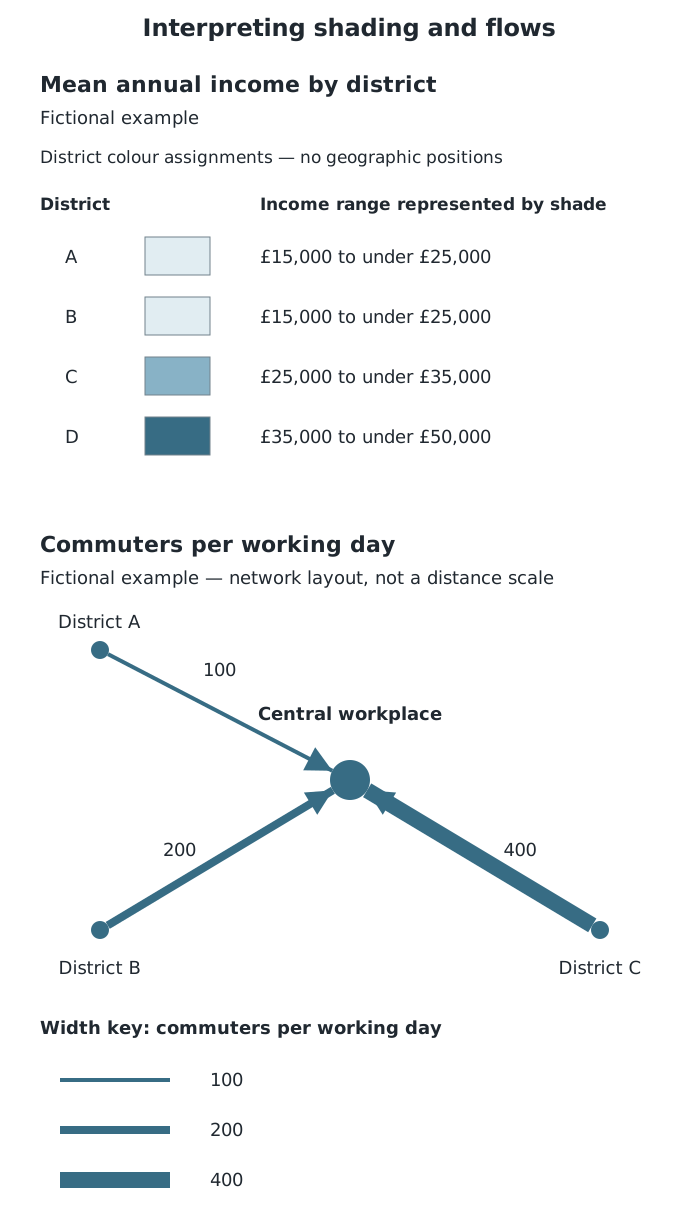
Compare income categories using shading and movement quantities using line widths. The income table does not locate the districts geographically.
Districts A and B fall in the £15,000 to under £25,000 category, C falls in the £25,000 to under £35,000 category, and D falls in the £35,000 to under £50,000 category. A supported comparison is therefore: District D has a higher mean annual income than District C, and both have higher mean annual incomes than A and B. A and B share a category, but their exact incomes need not be equal. The order of rows does not tell us where the districts lie.
On a choropleth map, these colours fill the districts within their geographic boundaries. After reading the categories, examine where similar shades occur: neighbouring areas with similar values form a cluster, while a change in shading across a region may reveal a directional contrast. Use the map's orientation to establish compass directions, not the order of categories in its key. Support the overall pattern with named places and value ranges, then identify any area that differs from its neighbours.
Remember that shading summarises an area. It does not show every household's income or differences within the district. Also, a large shaded district occupies more map space without necessarily containing more people. Income can indicate one aspect of development, but it does not measure all aspects, such as health or education.
A flow-line map uses lines to connect origins and destinations. Line width represents the quantity moving: a wider line means a larger flow. Where arrows are included, they show direction. The key identifies both the quantity and its unit, such as migrants per year, tourists per month or vehicles per day.
In the commuter panel, arrows run from three districts towards a central workplace. The widest line represents 400 commuters per working day, compared with 200 on the medium line and 100 on the narrow line. The largest flow is therefore twice the medium flow and four times the smallest flow. These comparisons concern numbers of commuters, not journey lengths.
A real transport example is Skinningrove in North Yorkshire. A public-transport flow-line map in a 2020 geographical skills handbook shows around 40 buses per day connecting it with Middlesbrough, but fewer than 10 per day with Guisborough or Whitby. This indicates a stronger bus connection with Middlesbrough; it does not establish how many passengers use those buses.
To interpret another flow-line map, locate the origins and destinations, use the width key to compare quantities, and identify the dominant connections. Lines may simplify movement rather than trace the actual road or travel route. A strong connection can suggest an important relationship between places, but the map alone may not explain why people travel.
Check the title, date, key and units before interpreting a diagram. Population figures may be numbers, thousands, millions or percentages.
On a population pyramid, read both sides for an age group. Check whether percentages refer to the whole population or separately to each sex.
Support a pattern with values and locations, then identify any exception. Distinguish an observed pattern from a possible explanation.
Do not assume that darker shading means greater development: follow the choropleth key.
On a flow-line map, width represents quantity, not distance. Only state a direction of movement when the map provides it.
It can see this note and what your specification asks for.
Answers are free with an account.
1 free note left this week
Get more free notesYour answer sets when this note comes back for review, or marks it complete.
Was this note helpful?
Log in to tell us whether it helped, or to report a problem.
Last updated
Population pyramid
A diagram showing the age and sex structure of a population using horizontal bars.
Population structure
The composition of a population, including the proportions of people in different age groups and sexes.
Absolute figure
The actual number of people or events, rather than their share of a total.
Choropleth map
A map that shades defined areas according to a key to show the values or value ranges of a geographical variable.
Flow-line map
A map showing movement between places, with line widths proportional to the quantities moving.
Spatial pattern
The arrangement of geographical features or values across an area, such as a cluster or a north–south contrast.
Put your knowledge into practice — try past paper questions for Geography A
Population pyramid
A diagram showing the age and sex structure of a population using horizontal bars.
Population structure
The composition of a population, including the proportions of people in different age groups and sexes.
Absolute figure
The actual number of people or events, rather than their share of a total.
Choropleth map
A map that shades defined areas according to a key to show the values or value ranges of a geographical variable.
Flow-line map
A map showing movement between places, with line widths proportional to the quantities moving.
Spatial pattern
The arrangement of geographical features or values across an area, such as a cluster or a north–south contrast.
State what the diagram shows before suggesting causes or implications. Check dates, scales and units before comparing diagrams.