

Loading…
Loading…
Loading…
Eduqas GCSE Geography A · C111
Eduqas C111 · 7.2.1 Challenges to Social Development Check the specification (PDF) (opens in a new tab)
Population change is closely connected to people's health, education, incomes and opportunities. These connections help explain changing populations in South Asia, including Pakistan, and sub-Saharan Africa, the part of Africa south of the Sahara, including Nigeria.
The birth rate is the number of live births per 1,000 people each year. The death rate is the number of deaths per 1,000 people each year. These are rates, not simply the total numbers of births and deaths: they allow populations of different sizes to be compared.
When births outnumber deaths, a population experiences natural increase. Migration also changes population size, but is not included in natural increase. If death rates fall while birth rates remain high, the gap between them widens and population can grow rapidly. A birth rate can therefore fall without the population shrinking.
Several social and economic factors can encourage larger families. They often reinforce one another rather than acting separately.
Limited access to contraception makes it harder for people to choose whether and when to have children. Access includes both the availability of contraceptives and information about how to use them.
High infant mortality can also encourage larger families. Infant mortality means deaths before a child's first birthday. Where parents fear that some children will not survive, they may have more children in the hope that some reach adulthood.
The economic contribution of children matters too. Where households rely on children's labour, children may help with farming, household work or earning income. This can encourage parents to have larger families. The connection is important here because it helps explain birth rates; the wider challenges of child labour are a separate issue.
In sub-Saharan Africa, limited contraception, high infant mortality and reliance on children's work help explain high birth rates in many places. However, countries and communities within the region do not all have the same circumstances.
Changes in women's opportunities can reduce birth rates. Improved women's rights give women greater control over family decisions and more opportunities to continue education and pursue careers. Later marriage can delay the start of childbearing and shorten the period during which couples have children.
Education about the benefits of smaller families, alongside access to contraception, helps people make informed choices. Raising fewer children may allow a household to devote more money and time to each child's health and education.
Improved healthcare can also lower birth rates indirectly. As infant mortality falls, parents can be more confident that their children will survive. If households become less dependent on children's labour, the economic incentive for larger families may weaken too.
These connections help explain falling birth rates in South Asia. In Pakistan, improvements in child survival, reduced reliance on child labour and greater educational and career opportunities for women can contribute to a declining birth rate, even while the population remains youthful.
Poor nutrition, disease, unsafe living and working conditions, and limited healthcare can cause people to die prematurely. Improvements in these conditions help more people survive into adulthood and old age.
Several changes can reduce deaths:
As survival improves, life expectancy—the average number of years a person can expect to live—generally rises. This does not mean that nobody dies, or that the total number of deaths must fall every year: population size and the number of older people also affect death totals.
The same change can have more than one influence. Better healthcare directly reduces premature deaths, but lower infant mortality can also encourage parents to choose smaller families.
Economic resources affect whether households can afford nutritious food and healthcare. They also affect whether governments can provide sanitation, medical services and vaccination programmes. Political decisions about these services, family-planning provision and women's rights therefore influence the conditions in which birth and death rates change.
For example, making vaccination available is a public-health decision, but its success also depends on funding and whether people can reach the service. Giving women greater rights can support smaller families, but opportunities for education and employment help turn those rights into practical choices. Population change is therefore not explained by income or government policy alone.
Population structure describes the composition of a population, especially its age and sex distribution. A population pyramid displays this using horizontal bars: younger age groups are at the bottom and older groups are above them. Males are usually shown on the left and females on the right.
Read the axis labels before interpreting the shape. Bar widths may show actual numbers or percentages. A percentage pyramid helps compare the structures of differently sized populations, but does not show which country has more people overall.
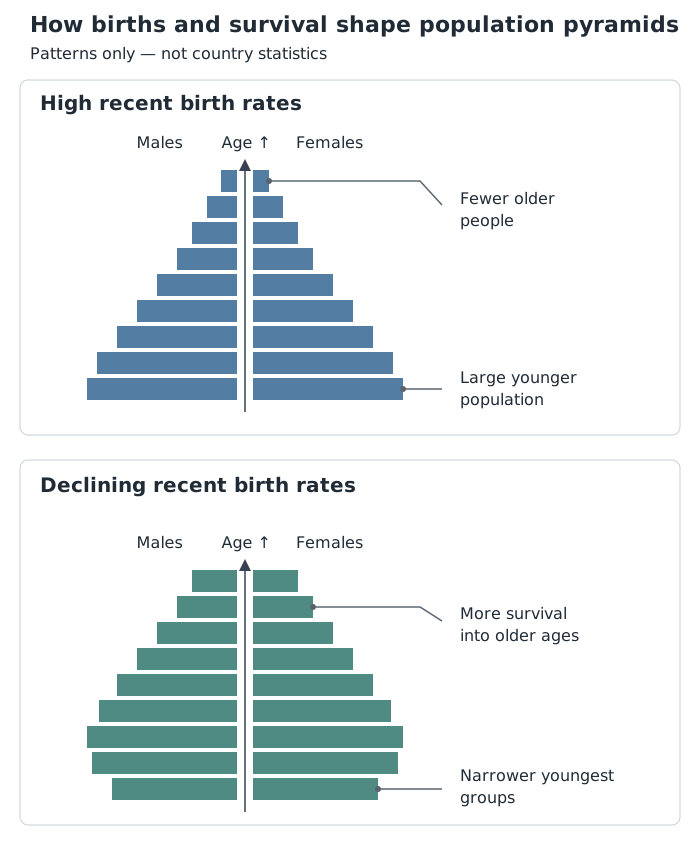
Read the youngest groups first, then follow the bars upwards. These patterns help connect recent births and survival with population structure.
Start with the base. A broad base means a large share of the population is young and usually suggests high recent birth rates. If the youngest bars are narrower than the bars immediately above them, this can suggest that births have fallen recently.
Next, follow the bars upwards. A pyramid that narrows sharply has relatively few older people. This is consistent with lower life expectancy and poorer survival, although the size of earlier generations and migration also affect the shape. A pyramid that stays wider further up indicates that more people are surviving to older ages.
Finally, look for differences between the male and female sides and for unusually wide or narrow age groups. Shape is evidence about population structure, not a complete explanation of its causes.
For a concrete reading example, suppose a pyramid shows 6% of the population as boys aged 0–4 and 6% as girls aged 0–4. Together, that age group contains 12% of the population. If the 5–9 age group contains 16%, the narrower youngest group suggests fewer recent births than in the preceding period. It does not, by itself, tell you whether this resulted from later marriage, contraception or another cause.
Nigeria, in West Africa, provides an example of a youthful population structure. Its broad-based, sharply narrowing pyramid indicates many children and relatively few older people. High birth rates are linked to limited contraception, high infant mortality and the economic role of children. Disease, poor living and working conditions, and limited healthcare help explain poorer survival to older ages.
Pakistan, in South Asia, also has a broad-based, youthful structure, but birth rates are decreasing. Improving healthcare, sanitation and diet help people survive longer, increasing life expectancy. Reduced infant mortality and a reduced need for children's labour can encourage smaller families, while greater opportunities for women can contribute to lower birth rates.
These examples show a regional contrast, not a rule that every country follows at the same speed. Birth and death rates can change at different times, and differences within each region remain important.
A large child population creates demand for schools, teachers and child healthcare. As those children grow up, demand for employment increases. A growing older population changes the demand for healthcare and support services.
Population pyramids therefore help governments plan ahead. Reading the shape identifies likely needs; explaining birth rates, death rates and survival helps explain why those needs are changing.
Higher birth rates: limited ; high infant mortality; households relying on children's labour.
Link each factor to its effect: for example, improved sanitation reduces the spread of disease, so fewer people die prematurely.
When comparing pyramids, compare the same age groups and check whether the horizontal axes show numbers or percentages.
A wide base suggests many recent births, but a pyramid alone cannot prove why birth rates are high or give an exact death rate.
Distinguish a falling birth rate from a falling population: population can still grow while births outnumber deaths.
It can see this note and what your specification asks for.
Answers are free with an account.
1 free note left this week
Get more free notesYour answer sets when this note comes back for review, or marks it complete.
Was this note helpful?
Log in to tell us whether it helped, or to report a problem.
Last updated
Birth rate
The number of live births per 1,000 people in a population each year.
Death rate
The number of deaths per 1,000 people in a population each year.
Infant mortality rate
The number of deaths of children under one year old per 1,000 live births in a year.
Life expectancy
The average number of years a person can expect to live.
Natural increase
An increase in population when births outnumber deaths, excluding migration.
Population structure
The composition of a population, particularly its distribution by age and sex.
Population pyramid
A graph showing the numbers or percentages of males and females in different age groups.
Contraception
Methods used to prevent pregnancy.
Sanitation
The safe disposal of sewage and other waste to protect health.
Put your knowledge into practice — try past paper questions for Geography A
Birth rate
The number of live births per 1,000 people in a population each year.
Death rate
The number of deaths per 1,000 people in a population each year.
Infant mortality rate
The number of deaths of children under one year old per 1,000 live births in a year.
Life expectancy
The average number of years a person can expect to live.
Natural increase
An increase in population when births outnumber deaths, excluding migration.
Population structure
The composition of a population, particularly its distribution by age and sex.
Population pyramid
A graph showing the numbers or percentages of males and females in different age groups.
Contraception
Methods used to prevent pregnancy.
Sanitation
The safe disposal of sewage and other waste to protect health.
Lower birth rates: improved women's rights; later marriage; education and careers; family planning; improved child survival; reduced reliance on child labour.
Lower death rates: better nutrition, medical care, vaccination, maternal and infant healthcare, sanitation, and responses to drought and famine.
Political influence: decisions about rights and public services affect access. Economic influence: funding and household incomes affect what is affordable.
Large child populations increase demand for education and child healthcare; population structure helps governments plan services.