Loading…


Loading…
Loading…
Loading…
Edexcel GCSE Combined Science · 1SC0
Edexcel 1SC0 · Ecosystems and Interdependence Check the specification (PDF) (opens in a new tab)
Counting every plant in a field would take a long time. Instead, ecologists count organisms in smaller areas called samples, then use these measurements to estimate the number in the whole habitat. The estimate depends on how well the samples represent the area.
A quadrat is a square frame enclosing a known area. Place it on the ground and count the individuals of the species being investigated inside it. Quadrats are particularly useful for plants because they stay in one place while being counted.
Two different questions need different sampling approaches. Random sampling helps estimate population size across an area. A belt transect investigates distribution: how the number of organisms changes from one part of a habitat to another, perhaps as light intensity changes.
To estimate the population of a plant species, you need a quadrat, two tape measures, a random number generator and a way to record results, such as paper on a clipboard.
Choosing patches with lots of plants would overestimate the population; choosing mostly bare patches would underestimate it. Random coordinates reduce this selection bias. A larger number of samples usually gives a more representative estimate, especially when plants grow in patches.
Use the same quadrat size and counting method throughout. If comparing sites, also use the same number of samples and the same coordinate-selection procedure.
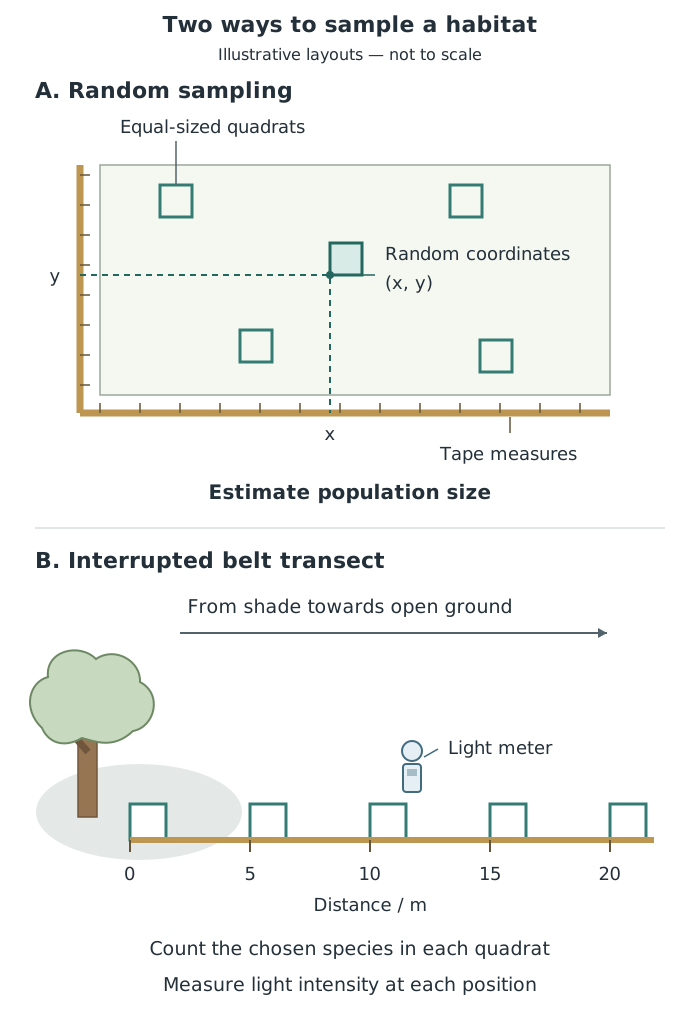
Random quadrats sample an area without deliberately choosing patches. An interrupted belt transect samples at regular distances across an environmental gradient.
First calculate the mean number of organisms per quadrat:
Then work out how many quadrat-sized areas fit into the whole habitat:
The habitat area and quadrat area must use the same units. For example, a quadrat with sides of 25 cm has sides of 0.25 m, so its area is .
Consider a teaching example in which five randomly placed 1 m² quadrats in a 500 m² field contain 5, 2, 6, 3 and 4 daisy plants. The total counted is 20, giving a mean of plants per quadrat. There are quadrat-sized areas in the field, so the estimated population is daisy plants.
This does not mean that exactly 2000 daisies have been counted. It assumes that the sampled mean is representative of the field as a whole.
Another equivalent approach is to calculate population density: divide the total count by the total sampled area to find plants per square metre, then multiply by the habitat area. This also works with raw counts from equal-sized quadrats along a belt transect. However, a transect deliberately crossing an environmental gradient may not represent the whole habitat, so its results should not automatically be scaled up to the entire area.
A belt transect samples a strip of habitat using quadrats along a line. Quadrats may be placed next to one another for continuous sampling, or at regular intervals for an interrupted belt transect. Regular spacing makes it possible to compare counts at known distances.
For example, investigate plant distribution from beneath a tree into open ground. Light intensity is the abiotic factor being studied. Begin with a testable hypothesis, such as: ‘The number of plants of this species increases as light intensity increases.’ This is a prediction to test, not a result to assume.
Record results in a table with columns for distance along the transect / m, number of plants and light intensity / lux. Measuring light matters: distance from a tree is not itself a measurement of light intensity.
Plot distance along the transect on the horizontal axis and mean number of plants per quadrat on the vertical axis. This shows how abundance changes across the habitat. Comparing plant counts with measured light intensity helps assess the hypothesis.
For a concrete teaching example, quadrats placed every 10 m towards woodland contain 12, 10, 11, 8 and 6 poppy plants. The overall count falls from 12 to 6, although it rises slightly between 10 m and 20 m. Describe this as an overall decrease, not a decrease at every point. Increasing shade near the woodland could help explain fewer plants because less light is available for photosynthesis and growth.
A relationship between light and plant counts supports an explanation, but does not establish light as the only cause. Other conditions may also change along the transect. Repeating transects improves confidence that the pattern is not just a feature of one narrow strip.
Small or difficult-to-identify plants may be missed or counted as the wrong species. Use a consistent identification and counting method. Too few samples may fail to represent patchy vegetation, so increase the number of samples rather than relying on one unusually crowded quadrat.
Light readings can vary with time of day, and plant abundance can vary with season. Consider these when comparing results. Some plants can cause cuts or allergic reactions; wear gloves when handling them.
Get unlimited access to all revision notes, key terms, and exam tips.
Alternatively: total count ÷ total sampled area = population density; density × habitat area = estimated population.
Use matching area units. Scaling up assumes the samples represent the habitat.
Get unlimited access to all revision notes, key terms, and exam tips.
Describe random sampling precisely: generate random coordinates and place the quadrat at those coordinates. Throwing a quadrat is not a reliable random method.
Calculate quadrat area, not just its side length. A 25 cm × 25 cm quadrat has an area of 0.0625 m².
Distinguish the mean number per quadrat from the mean number per square metre before scaling up.
For a transect conclusion, quote results, describe the trend and link it to the environmental factor. A correlation alone does not prove causation.
Quadrat
A square frame enclosing a known area, used to sample organisms within that area.
Random sampling
Selecting sampling locations by chance rather than choosing them deliberately, to reduce selection bias.
Belt transect
A survey of a strip of habitat using quadrats placed along a line, either next to one another or at regular intervals.
Distribution
The pattern of where organisms occur within an area.
Population size
The number of organisms of one species living in a defined area.
Population density
The number of organisms per unit area, for example plants per square metre.
Environmental gradient
A gradual change in an environmental factor across an area, such as increasing light intensity from shade to open ground.
Abiotic factor
A non-living feature of the environment, such as light intensity, temperature or water availability.
Put your knowledge into practice — try past paper questions for Combined Science
Quadrat
A square frame enclosing a known area, used to sample organisms within that area.
Random sampling
Selecting sampling locations by chance rather than choosing them deliberately, to reduce selection bias.
Belt transect
A survey of a strip of habitat using quadrats placed along a line, either next to one another or at regular intervals.
Distribution
The pattern of where organisms occur within an area.
Population size
The number of organisms of one species living in a defined area.
Population density
The number of organisms per unit area, for example plants per square metre.
Environmental gradient
A gradual change in an environmental factor across an area, such as increasing light intensity from shade to open ground.
Abiotic factor
A non-living feature of the environment, such as light intensity, temperature or water availability.