Loading…


Loading…
Loading…
Loading…
AQA GCSE Physical Education · 8582
AQA 8582 Check the specification (PDF) (opens in a new tab)
A spirometer records changes in breathing volume, producing a graph called a spirometer trace. This lets us compare how deeply and how frequently someone breathes at rest and during exercise.
Start by reading the axes. Time runs along the horizontal axis, while volume is shown on the vertical axis, often in litres or cubic decimetres. One litre equals one cubic decimetre: .
In the diagram below, the vertical axis represents the volume of air in the lungs, so the line rises during inspiration and falls during expiration. One complete rise and fall represents one breath. Always check the supplied graph's labels, because some recording arrangements show the opposite direction.
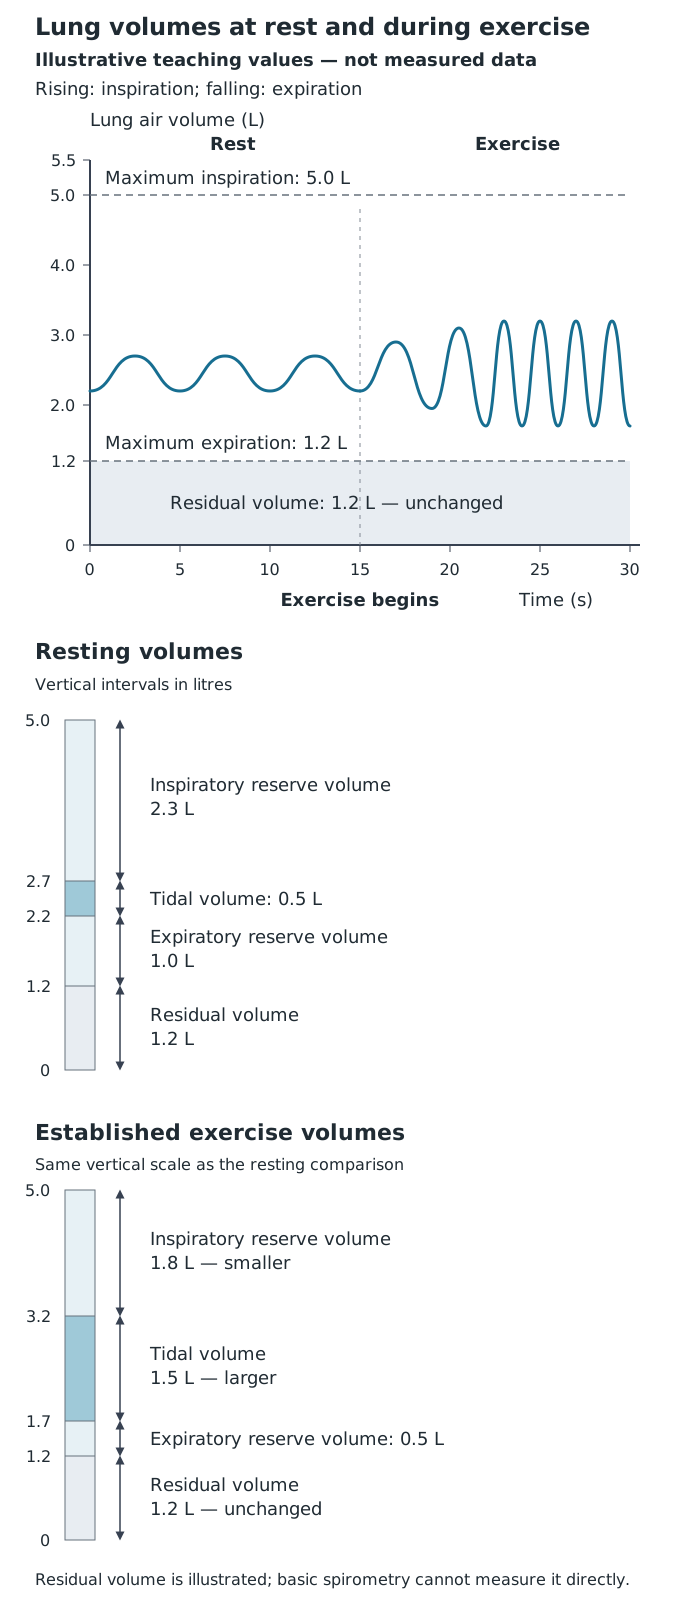
Larger vertical swings represent deeper breaths; closer cycles represent faster breathing.
During normal breathing, only part of the air in the lungs is exchanged. Tidal volume is the amount breathed in or out in one normal breath. On this trace, it is the vertical distance from a normal expiration trough to the next inspiration peak. It is not the total amount of air in the lungs at the peak.
In the constructed resting example, the volume rises from 2.2 L to 2.7 L. The tidal volume is therefore per breath. Breathing that air out completes the same breath; it does not double the tidal volume.
You can breathe in more air after finishing a normal inhalation. This extra amount is the inspiratory reserve volume. Identify it between the normal inspiration peak and the maximum inspiration level. Here, it is at rest.
Similarly, you can force out more air after a normal exhalation. This is the expiratory reserve volume, shown between the normal expiration trough and the maximum expiration level. Here, it is at rest.
Even after breathing out as much as possible, air remains in the lungs. This is the residual volume. In the teaching diagram, it is the region from zero to the maximum expiration level: 1.2 L. The normal trough is higher than this because an ordinary breath out does not use the expiratory reserve.
During exercise, working muscles require more oxygen and produce more carbon dioxide. Breathing becomes deeper and faster, helping increase the exchange of these gases.
Deeper breathing increases tidal volume. The normal inspiration peaks move towards the maximum inspiration level, while the normal expiration troughs move towards the maximum expiration level. More of the available volume is now used in each ordinary breath, leaving smaller inspiratory and expiratory reserves. Residual volume stays the same.
In the exercise section, breaths range from 1.7 L to 3.2 L. Tidal volume has increased to . The inspiratory reserve has decreased to , and the expiratory reserve has decreased to . Lung volumes vary from person to person.
The graph separates two changes that are easy to confuse. Larger vertical swings show increased tidal volume: deeper breaths. More complete cycles in the same time show increased breathing rate: faster breaths. You can determine breathing rate by counting complete breaths in a timed interval and scaling to one minute. For example, six breaths in 30 seconds gives 12 breaths per minute.
To continue a resting trace through the onset of exercise, carry the line forwards from its existing endpoint. Draw progressively larger rises and falls, with the cycles becoming closer together along the time axis. Keep the normal breaths within the maximum inspiration and expiration limits, and leave residual volume unchanged.
An explanation should connect the pattern to its meaning: the breaths become deeper and more frequent, increasing the amount of air exchanged to meet the demands of exercise.
Get unlimited access to all revision notes, key terms, and exam tips.
Check the axes and direction first. Draw larger vertical swings for deeper breaths and closer cycles for faster breathing. These changes increase air exchange as working muscles require more oxygen and produce more carbon dioxide.
Get unlimited access to all revision notes, key terms, and exam tips.
Measure tidal volume as the vertical difference between a normal breath's peak and trough, not the peak's height above zero.
Identify inspiration and expiration from the axis labels and direction of the supplied trace; do not assume every trace rises during inspiration.
When continuing a trace for exercise, show both deeper breaths and more frequent breaths: larger vertical swings and smaller horizontal gaps.
Residual volume remains after maximal expiration. Do not draw the lungs emptying to zero.
Spirometer trace
A graph showing changes in breathing volume over time.
Tidal volume
The volume of air breathed in or out in one normal breath.
Inspiratory reserve volume
The additional volume of air that can be breathed in after a normal inhalation.
Expiratory reserve volume
The additional volume of air that can be breathed out after a normal exhalation.
Residual volume
The volume of air remaining in the lungs after maximal exhalation.
Breathing rate
The number of breaths taken in one minute.
Put your knowledge into practice — try past paper questions for Physical Education
Spirometer trace
A graph showing changes in breathing volume over time.
Tidal volume
The volume of air breathed in or out in one normal breath.
Inspiratory reserve volume
The additional volume of air that can be breathed in after a normal inhalation.
Expiratory reserve volume
The additional volume of air that can be breathed out after a normal exhalation.
Residual volume
The volume of air remaining in the lungs after maximal exhalation.
Breathing rate
The number of breaths taken in one minute.