

Loading…
Loading…
Loading…
AQA GCSE Combined Science: Synergy · 8465
AQA 8465 · 4.2.1.6 Human Nervous System Check the specification (PDF) (opens in a new tab)
Reaction time is the time between a stimulus occurring and a person responding to it. When you catch a falling ruler, its movement is the stimulus. Receptors detect the movement, the nervous system processes the information, and muscles contract to close your fingers. Catching the ruler is a conscious response, rather than an automatic protective reflex.
Reaction times vary between people and with the conditions of the test. Typical human reaction times range from 0.3 to 0.9 seconds. This is a typical range, not a boundary that every measurement must fall within: results depend on the task and the person. Factors such as age, stress and caffeine intake can affect reaction time.
A ruler-drop test measures how far a ruler falls before someone catches it. A longer delay allows the ruler to fall further, so a smaller distance means a faster reaction. The distance is then converted into a time.
You need a partner, a metre ruler, a table and chair, a results table and a distance–time conversion table. A metre ruler gives more opportunity to catch the ruler than a short ruler.
Keep the falling ruler away from faces and clear the space below the hand. Participants should take part willingly and be able to stop if uncomfortable. If the ruler is missed, record a missed catch rather than inventing a distance.
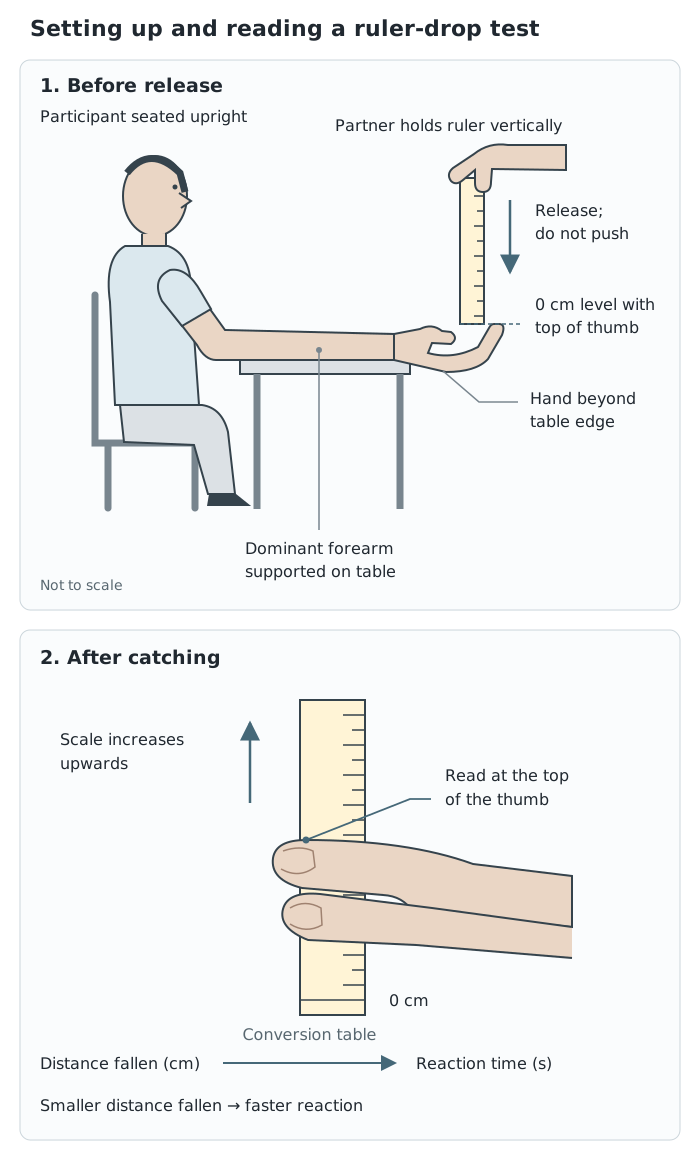
Start with the zero mark aligned with the top of the thumb; after catching, read the distance fallen at the same position.
A ruler reading is a distance, not a reaction time. Use a distance–time conversion table to find the corresponding time in seconds. For example, the following pairs show how ruler measurements can be converted:
| Distance fallen / cm | Reaction time / s |
|---|---|
| 19 | 0.20 |
| 30 | 0.25 |
| 48 | 0.31 |
The 19 cm catch represents the fastest response of these three. The relationship is not directly proportional because a falling ruler speeds up: doubling the distance does not double the time. Convert each reading before calculating a mean reaction time.
A computer-based test provides another method. A visual stimulus appears on screen, and the participant presses a key or clicks as soon as they detect it. The programme records the interval directly, often in milliseconds, where . This avoids manually reading a ruler scale, although the device and the participant’s attention can still affect the result.
Required practical activity 8 investigates the effect of a factor on human reaction time. One manageable question is: Does background music change reaction time compared with a quiet room?
A reasonable hypothesis is that music may distract the participant, increasing their reaction time. This is a prediction to test, not a result to assume.
The independent variable is the background condition: quiet or music. The dependent variable is reaction time, obtained from the ruler-drop distance. Keep the following conditions constant:
Use music at a comfortable, safe volume. There is no need to expose participants to very loud sound or give them substances to investigate reaction time.
Give each participant the same short practice period. Then collect, for example, ten catches in quiet conditions and ten with music. Each participant completes both conditions, allowing a comparison within the same person. Where several people take part, have some complete the quiet condition first and others the music condition first. This helps prevent practice or tiredness from being confused with the effect of music.
Prepare the results table before starting. For each numbered attempt, record separate columns for ruler distance in cm and converted reaction time in s for each participant under each condition. This keeps the repeated measurements and the comparisons clearly organised.
Calculate a mean reaction time for each participant in each condition:
A higher mean with music would support the prediction that this distraction slowed responses. A lower mean would suggest faster responses, while similar means would provide little evidence of an effect under the conditions tested. Use the results to decide whether the hypothesis is supported, rather than treating the prediction as proof.
Look at the spread of the repeated results as well as their means. A small difference between means is less convincing if the individual readings vary greatly. More participants help you judge whether a pattern extends beyond one person.
Possible problems include anticipating the drop, inconsistent zero-mark alignment, misreading the scale and improvement through practice. Repeats reduce the influence of random variation, but they cannot fix a starting position that is wrong every time. Investigate unusually different readings and repeat a trial where possible; only exclude a result with a justified reason.
Reaction time also matters in road safety. A driver continues travelling between noticing a hazard and starting to brake. At the same speed, a longer reaction time therefore means a greater thinking distance.
Ruler drop: dominant forearm supported, hand over table edge; ruler vertical with 0 cm downwards and aligned with the top of the thumb. Drop without warning of the exact moment, catch, and read at the top of the thumb.
Smaller distance → shorter reaction time. Convert each distance using a distance–time table. Rest and repeat.
A smaller ruler reading means a shorter reaction time: the ruler travelled less distance before being caught.
Identify the factor you change as the independent variable, and reaction time as the dependent variable. Keep other relevant conditions constant.
Record ruler distance in cm and reaction time in s in separate columns; they are different quantities.
Investigate an unusual result before excluding it. Do not remove a result simply because it disagrees with your prediction.
Explain that repeats and a mean reduce the influence of random variation; they do not correct a consistently incorrect starting position.
It can see this note and what your specification asks for.
Answers are free with an account.
1 free note left this week
Get more free notesYour answer sets when this note comes back for review, or marks it complete.
Was this note helpful?
Log in to tell us whether it helped, or to report a problem.
Last updated
Reaction time
The time between a stimulus occurring and a person responding to it.
Stimulus
A change in the surroundings that can be detected by a receptor and lead to a response.
Independent variable
The factor deliberately changed in an investigation.
Dependent variable
The quantity measured to find the effect of changing the independent variable.
Control variable
A condition kept constant so that it does not provide an alternative explanation for the results.
Mean
An average calculated by adding the values and dividing by the number of values.
Anomalous result
A result that is noticeably different from the pattern of the other results.
Put your knowledge into practice — try past paper questions for Combined Science: Synergy
Reaction time
The time between a stimulus occurring and a person responding to it.
Stimulus
A change in the surroundings that can be detected by a receptor and lead to a response.
Independent variable
The factor deliberately changed in an investigation.
Dependent variable
The quantity measured to find the effect of changing the independent variable.
Control variable
A condition kept constant so that it does not provide an alternative explanation for the results.
Mean
An average calculated by adding the values and dividing by the number of values.
Anomalous result
A result that is noticeably different from the pattern of the other results.
Computer test: respond to an on-screen stimulus; the programme records the interval directly. .
Investigate one factor, such as quiet conditions versus background music.
Compare means and spread. Support the conclusion with results; consider anticipation, reading errors and practice effects.