Loading…


Loading…
Loading…
Loading…
AQA GCSE Combined Science Trilogy · 8464
AQA 8464 · 4.2.3.2 Plant organ system Check the specification (PDF) (opens in a new tab)
Transpiration is the loss of water vapour from leaves through the stomata. Water delivered by the xylem evaporates from moist surfaces inside the leaf into its air spaces. Water vapour then diffuses through the stomata into the surrounding air.
The air inside a leaf is normally more humid than the air outside. This difference creates a concentration gradient: water vapour moves overall from its higher concentration inside the leaf to its lower concentration outside. The rate of water loss therefore depends both on how quickly water evaporates and on how easily water vapour escapes.
Water uptake replaces water lost from the leaves, maintaining the transpiration stream through the plant. Environmental conditions can change how quickly this happens.
Increasing temperature generally increases transpiration rate. Water molecules have more kinetic energy, so evaporation from the internal leaf surfaces is faster and water vapour diffuses more quickly.
Increasing humidity generally decreases transpiration rate. Humid air already contains more water vapour, so the concentration difference between the leaf's air spaces and the surrounding air is smaller. Less water vapour diffuses out per unit time. In drier air, the concentration gradient is steeper and transpiration is faster.
These predictions assume that other conditions remain the same. Comparing a warm, humid environment with a cool, dry one is less straightforward because temperature and humidity act in opposite directions.
In still air, water vapour leaving a leaf can build up around its surface. Increasing air movement carries this water vapour away and replaces it with less humid air. This maintains a steeper concentration gradient, increasing the rate of diffusion and therefore transpiration.
Increasing light intensity generally increases transpiration because stomata tend to open in the light. Open stomata allow carbon dioxide to enter for photosynthesis, but also allow more water vapour to escape. In darkness, stomata tend to close, reducing water loss.
These are general relationships, not promises that the rate will increase without limit. In dry conditions, plants may close their stomata to conserve water. Stomatal closure also restricts gas exchange.
A bubble potometer measures water uptake by a leafy shoot. As the shoot takes up water, an air bubble moves along a narrow capillary tube. A ruler measures its movement and a timer measures the elapsed time. Faster bubble movement indicates faster water uptake and is used to estimate transpiration rate.
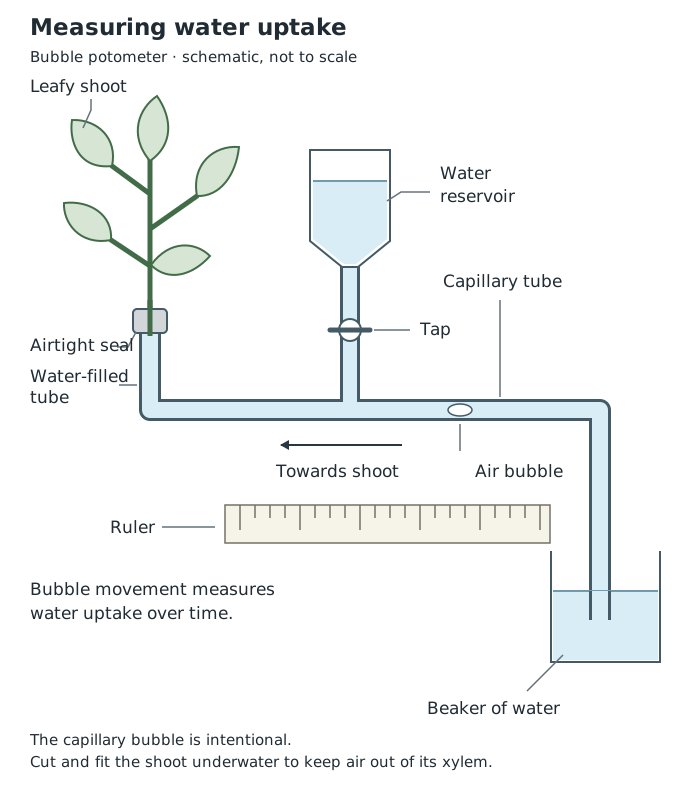
A bubble potometer tracks water uptake using the movement of an air bubble over a measured time.
The apparatus is filled with water, and the shoot is cut and fitted underwater to prevent air entering the xylem. Connections must be sealed so that they are airtight and watertight. The leaves should be dry. A single air bubble is introduced into the capillary tube, and the shoot is allowed to adjust to the conditions before measurements begin.
Record the bubble's starting position, wait for a measured time, then record its final position. A reservoir and tap allow the bubble to be reset for another measurement.
To investigate one environmental factor, change that factor while keeping the others constant. For example, move a lamp to change light intensity while keeping temperature, humidity and air movement constant. A lamp may also warm the leaves, so temperature needs checking. Use the same shoot to keep leaf area consistent, and repeat measurements at each setting to calculate a mean.
The measurement is an estimate, not a direct measurement of transpiration: the apparatus measures water taken up rather than water vapour lost, and some water is used by the plant rather than transpired.
A rate tells us how much change occurs per unit time. For water loss itself:
Depending on the measurement, units might be g/min for mass lost or cm³/min for volume lost. For a bubble potometer, a useful indicator is:
For example, suppose a bubble starts at the 10 mm mark and finishes at the 22 mm mark after 5 minutes. It has travelled mm, so its movement rate is mm/min. This means that it moved an average of 2.4 mm each minute; it does not mean that the plant lost 2.4 mm³ of water each minute.
Dividing by time makes measurements taken over different durations comparable. Bubble movement rates should be compared using the same capillary tube dimensions and comparable shoots.
The following constructed practice data illustrate a possible humidity trend. They are not experimental observations. Each measurement uses the same shoot and capillary tube, with other environmental conditions held constant.
| Relative humidity (%) | Bubble distance in 5 min (mm) | Bubble movement rate (mm/min) |
|---|---|---|
| 20 | 12 | 2.4 |
| 40 | 9 | 1.8 |
| 60 | 6 | 1.2 |
| 80 | 3 | 0.6 |
Calculate each rate by dividing its distance by 5 minutes. Put humidity, the independent variable, on the horizontal axis and bubble movement rate, the dependent variable, on the vertical axis. Both variables are continuous, so plot a graph of points with an appropriate line or curve rather than separate categorical bars.
Use regular numerical intervals and scales that spread the points across much of the available space. For these values, horizontal intervals of 20 percentage points and vertical intervals of 0.6 mm/min work well. Label both axes with their quantities and units, plot each pair accurately, and draw a suitable best-fit line or curve.
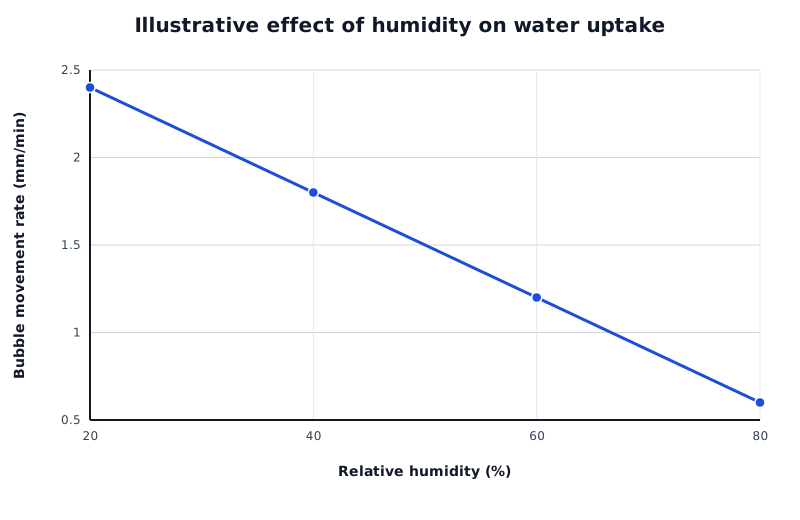
In these data, increasing humidity is associated with slower bubble movement when other conditions are unchanged.
Data for Illustrative effect of humidity on water uptake
| Series | Relative humidity (%) | Bubble movement rate (mm/min) |
|---|---|---|
| Illustrative bubble movement rate | 20 | 2.4 |
| Illustrative bubble movement rate | 40 | 1.8 |
| Illustrative bubble movement rate | 60 | 1.2 |
| Illustrative bubble movement rate | 80 | 0.6 |
To recover numerical information from the graph, start at a humidity value on the horizontal axis, move up to the line, then across to the vertical axis. At 60% humidity, the rate is 1.2 mm/min. This point can be transferred back into a table as the pair 60% and 1.2 mm/min.
The graph shows a negative relationship: as humidity increases, the rate decreases. Between 20% and 80% humidity, the rate falls from 2.4 to 0.6 mm/min. The biological explanation is that more humid surrounding air reduces the water-vapour concentration gradient out of the leaf.
Reading between plotted values is interpolation. This straight line gives an estimated rate of 1.5 mm/min at 50% humidity. Real results need not follow this exact line, and extending a trend beyond the measured range is less secure.
For any graph, chart or table, first check what is measured and its units. Then identify the pattern, support it with values, and connect it to the relevant biological mechanism.
Get unlimited access to all revision notes, key terms, and exam tips.
With other conditions unchanged:
| Increase in… | Usual effect on transpiration | Reason |
|---|---|---|
| Temperature | Increases | Faster evaporation and diffusion |
| Humidity | Decreases | Smaller water-vapour concentration gradient |
| Air movement | Increases | Removes humid air from around leaves |
| Light intensity | Increases | Stomata open for gas exchange |
Stomatal closure in dry conditions can reduce water loss.
For a bubble potometer:
Distance in mm divided by time in minutes gives mm/min. A potometer measures water uptake, providing an estimate of transpiration.
Change one environmental factor, control the others and leaf area, and repeat measurements to obtain a mean.
Get unlimited access to all revision notes, key terms, and exam tips.
Explain environmental effects using a mechanism: evaporation, the water-vapour concentration gradient or stomatal opening.
A bubble potometer measures water uptake, not water loss directly. Bubble speed is an indicator of transpiration rate.
Calculate distance travelled by subtracting the starting position from the final position, then divide by elapsed time.
Label graph axes with quantities and units, use evenly spaced numerical scales, and follow the question's instructions about the line or curve.
When comparing results, quote relevant values and units rather than saying only that one rate is higher.
Transpiration
The loss of water vapour from a plant's leaves through the stomata.
Transpiration rate
The amount of water a plant loses by transpiration per unit time.
Stoma
A pore in a leaf's surface through which gases, including water vapour, can diffuse; its opening is controlled by guard cells.
Humidity
A measure of how much water vapour is present in the air.
Concentration gradient
A difference in the concentration of a substance between two regions. Net diffusion occurs from higher to lower concentration.
Potometer
An apparatus that measures water uptake by a leafy shoot, allowing transpiration rate to be estimated.
Compound measure
A measure combining two quantities, such as distance divided by time, expressed in units such as mm/min.
Put your knowledge into practice — try past paper questions for Combined Science Trilogy
Transpiration
The loss of water vapour from a plant's leaves through the stomata.
Transpiration rate
The amount of water a plant loses by transpiration per unit time.
Stoma
A pore in a leaf's surface through which gases, including water vapour, can diffuse; its opening is controlled by guard cells.
Humidity
A measure of how much water vapour is present in the air.
Concentration gradient
A difference in the concentration of a substance between two regions. Net diffusion occurs from higher to lower concentration.
Potometer
An apparatus that measures water uptake by a leafy shoot, allowing transpiration rate to be estimated.
Compound measure
A measure combining two quantities, such as distance divided by time, expressed in units such as mm/min.