Loading…


Loading…
Loading…
Loading…
AQA GCSE Combined Science Trilogy · 8464
AQA 8464 · Nervous System Structure and Function Check the specification (PDF) (opens in a new tab)
Reaction time is the interval between a stimulus occurring and a person responding. In a ruler-drop test, the stimulus is the ruler beginning to fall. Receptors in the eyes detect its movement, information travels to the brain, and the brain sends impulses to the muscles that close the fingers. Catching the ruler is a conscious response, not an automatic reflex action.
A ruler provides an indirect measurement of reaction time. While the person is responding, the ruler continues to fall. A shorter fall therefore indicates a shorter reaction time and a faster response. A conversion table turns the distance fallen, measured in centimetres, into a time in seconds.
Required practical activity 6 involves planning and carrying out an investigation into the effect of a factor on human reaction time. One suitable investigation asks whether practice reduces reaction time.
Use a metre ruler, a chair, a table and a partner, together with a distance-to-time conversion table. For this investigation, the catcher uses their weaker hand and starts recording immediately, without practising beforehand. This allows any change as they gain practice to be observed.
The independent variable is the amount of practice, represented by attempt number. The dependent variable is reaction time, obtained from the distance the ruler falls. Keep the same catcher, hand, dropper, ruler and starting position throughout each sequence. Otherwise, a change in the results might be caused by something other than practice.
Decide in advance how many attempts to record—for example, ten—and keep the interval between attempts similar. Record each attempt separately rather than averaging all ten together: an overall average would hide any change with practice.
Vary the waiting time before each release. A countdown or a predictable delay could allow the catcher to anticipate the drop, so the measurement would no longer represent their response to seeing the ruler move. Release the ruler without pushing it downwards, and keep the starting hand position consistent.
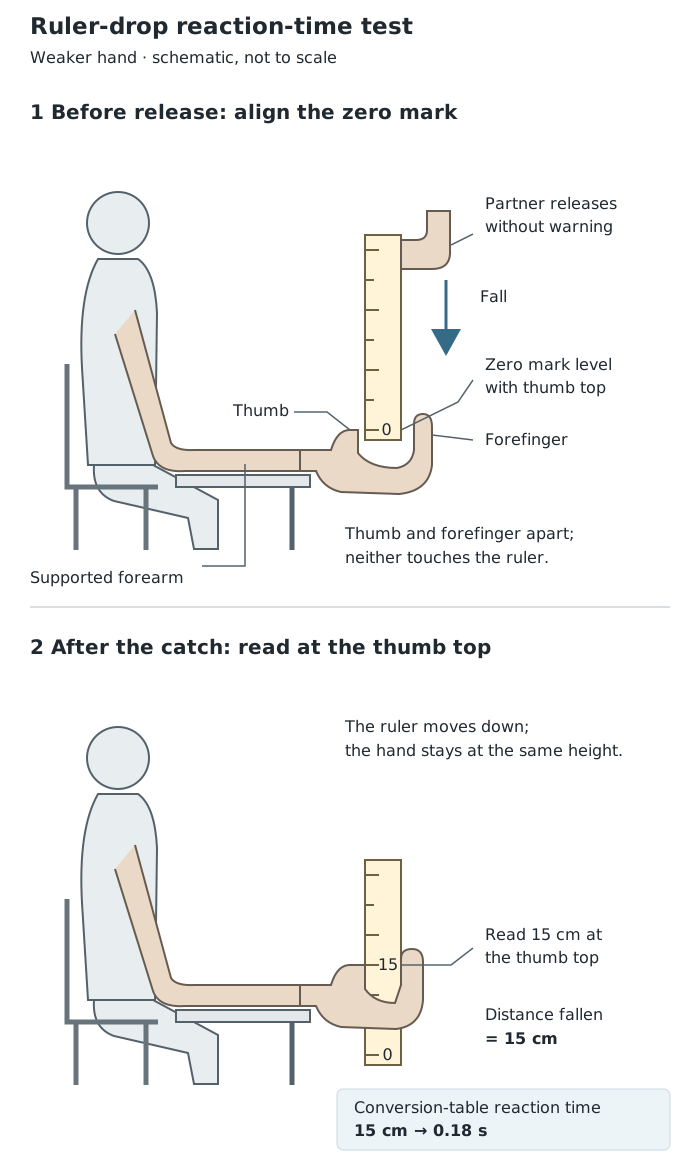
Keep the starting alignment constant. The reading at the top of the thumb after the catch gives the distance fallen.
Participants should agree to take part and be able to stop if uncomfortable. The person dropping the ruler should wear goggles because a missed ruler could hit the floor and bounce towards the eyes. Follow the teacher's safety instructions.
A conversion table contains paired values: a ruler reading in centimetres and its corresponding reaction time in seconds. Locate the distance first, then read its matching time. In a table arranged in several blocks, use the time entry in the same block as the distance, not an entry from a neighbouring block.
These selected conversion values show how to use the table:
| Distance fallen / cm | Reaction time / s |
|---|---|
| 5 | 0.10 |
| 10 | 0.14 |
| 12 | 0.16 |
| 15 | 0.18 |
| 20 | 0.21 |
| 25 | 0.23 |
| 30 | 0.25 |
For example, a catch at 15 cm corresponds to 0.18 s. Distance and time are not directly proportional: 20 cm is four times 5 cm, but its corresponding time is only about twice as long. Use the conversion table rather than treating a percentage change in distance as the same percentage change in time.
Some tests report milliseconds. Since , a reaction time of 0.18 s is 180 ms. Convert to the same unit before comparing results.
The following results demonstrate the method.
| Attempt number | Distance fallen / cm | Reaction time / s |
|---|---|---|
| 1 | 30 | 0.25 |
| 2 | 25 | 0.23 |
| 3 | 20 | 0.21 |
| 4 | 15 | 0.18 |
| 5 | 12 | 0.16 |
Put attempt number on the horizontal axis and reaction time in seconds on the vertical axis. Choose evenly spaced scales and plot each attempt-time pair. Joining successive points helps show the change through the sequence.
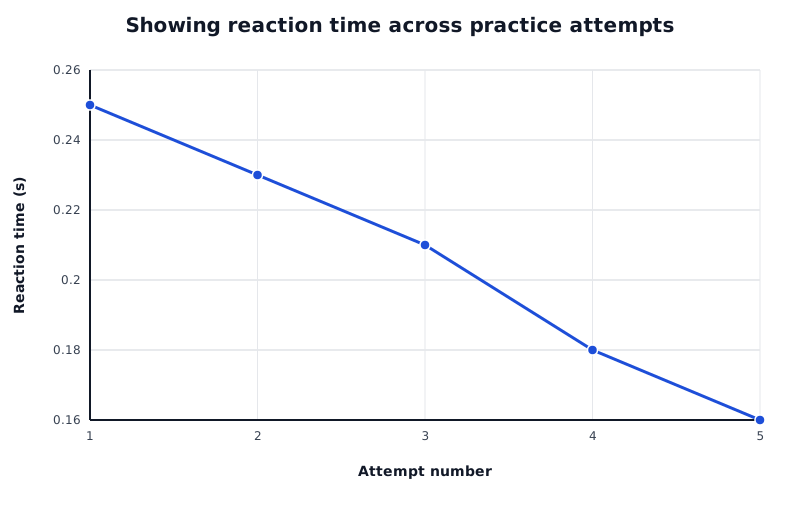
Decreasing reaction time across successive attempts would support an improvement with practice.
Data for Showing reaction time across practice attempts
| Series | Attempt number | Reaction time (s) |
|---|---|---|
| Illustrative reaction times | 1 | 0.25 |
| Illustrative reaction times | 2 | 0.23 |
| Illustrative reaction times | 3 | 0.21 |
| Illustrative reaction times | 4 | 0.18 |
| Illustrative reaction times | 5 | 0.16 |
The downward trend represents faster responses, not slower ones. Reaction time falls from 0.25 s on attempt 1 to 0.16 s on attempt 5—a decrease of 0.09 s. These results would support the suggestion that practice reduced reaction time for this person over these attempts.
To translate the graph back into numerical information, locate an attempt on the horizontal axis, move up to its plotted point, and read across to the time axis. For example, attempt 3 corresponds to 0.21 s. The same approach applies to other nervous-system graphs: first identify what each axis measures and its units, then read values and describe the relationship.
When comparing categories, such as two hands or quiet conditions versus a distraction, collect several readings in each condition. Convert each reading into a reaction time before calculating a mean time. For example, for times of 0.14, 0.16, 0.18, 0.16 and 0.16 s, the total is 0.80 s; dividing by five gives a mean of 0.16 s. A bar chart is suitable for comparing the mean times of separate categories.
Practice can become an unwanted influence when testing another factor. For example, if every quiet test happens before every distraction test, any improvement with practice could affect the comparison. Alternating the conditions or varying their order between participants helps reduce this problem. This differs from investigating practice itself, when the early attempts must be retained.
Look at variation as well as the mean. Widely scattered repeats make a comparison less convincing than closely grouped results. An unusually short time could indicate anticipation; an unusually long time could reflect a lapse in attention. Investigate unexpected readings rather than automatically deleting them.
For the practice investigation, repeating the sequence with more participants helps show whether the pattern extends beyond one person. Results can be compared at matching attempt numbers, preserving the change with practice. A ruler test is limited by reading precision, release cues and variation in attention, so conclusions should reflect the size and consistency of the evidence.
Get unlimited access to all revision notes, key terms, and exam tips.
Investigate a factor affecting human reaction time using a ruler-drop test.
Vary the release delay to prevent anticipation. Repeat measurements and use more participants. When investigating another factor, control the influence of practice. Catching a ruler is a conscious response, not a reflex.
Get unlimited access to all revision notes, key terms, and exam tips.
A shorter reaction time means a faster response. A ruler reading in centimetres is a distance, not a time.
If practice is the factor being investigated, record results from the first attempt: practice catches beforehand would change the starting condition.
Identify an anomalous result, but do not remove it simply because it does not fit the expected trend. Explain any exclusion and repeat the measurement where appropriate.
Support conclusions with figures and units. Say that results support an effect rather than claiming that a small investigation proves it.
Reaction time
The time between a stimulus occurring and a person responding to it.
Independent variable
The factor deliberately changed or compared in an investigation.
Dependent variable
The quantity measured to find out whether the independent variable has an effect.
Control variable
A factor kept the same so that it does not provide an alternative explanation for the results.
Mean
An average calculated by adding the values and dividing by the number of values included.
Anomalous result
A result that is noticeably different from the other results or the overall pattern.
Put your knowledge into practice — try past paper questions for Combined Science Trilogy
Reaction time
The time between a stimulus occurring and a person responding to it.
Independent variable
The factor deliberately changed or compared in an investigation.
Dependent variable
The quantity measured to find out whether the independent variable has an effect.
Control variable
A factor kept the same so that it does not provide an alternative explanation for the results.
Mean
An average calculated by adding the values and dividing by the number of values included.
Anomalous result
A result that is noticeably different from the other results or the overall pattern.