Loading…


Loading…
Loading…
Loading…
AQA GCSE Combined Science Trilogy · 8464
AQA 8464 · 6.5.4.1.5 Acceleration Check the specification (PDF) (opens in a new tab)
A velocity-time graph shows how an object's velocity changes during its motion. Velocity is speed in a specified direction. Time goes on the horizontal axis, in seconds, and velocity goes on the vertical axis, in metres per second.
To draw a graph from measurements, choose evenly spaced scales that cover the data and use a useful proportion of the graph paper. Label both axes with their quantities and units, then plot each time–velocity pair. For example, a velocity of 4 m/s at 2 s is plotted at .
The following table is an example. It represents an object moving along a straight line without reversing direction.
| Time (s) | Velocity (m/s) |
|---|---|
| 0 | 0 |
| 2 | 4 |
| 4 | 8 |
| 6 | 8 |
| 8 | 0 |
These points form three straight sections. With real measurements, draw a line or smooth curve that represents the trend; small measurement variations should not automatically become sharp changes in motion.
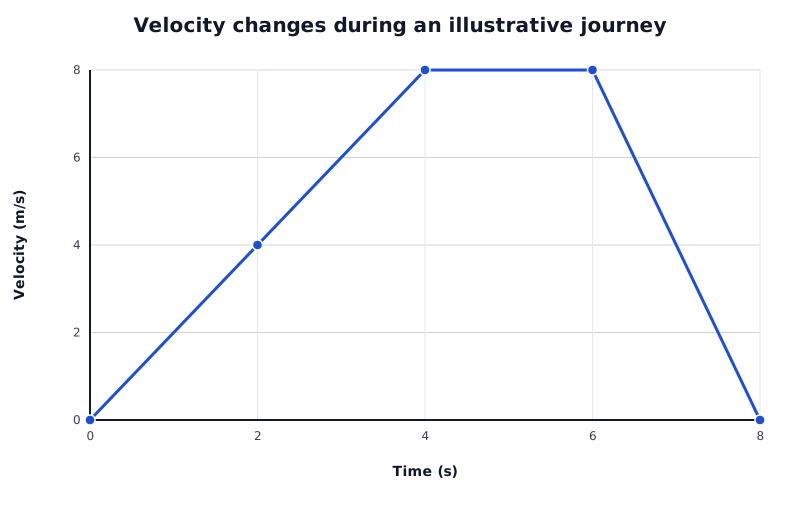
Constant positive acceleration from 0–4 s, constant velocity from 4–6 s, and deceleration from 6–8 s. For Higher Tier, the area between the line and time axis gives the total distance.
Data for Velocity changes during an illustrative journey
| Series | Time (s) | Velocity (m/s) |
|---|---|---|
| Illustrative motion | 0 | 0 |
| Illustrative motion | 2 | 4 |
| Illustrative motion | 4 | 8 |
| Illustrative motion | 6 | 8 |
| Illustrative motion | 8 | 0 |
The height of the graph tells you the velocity at that time. Its gradient, or slope, tells you how quickly velocity is changing: the acceleration.
From 0 to 4 s in the graph, velocity increases steadily. The straight upward-sloping line shows constant positive acceleration. From 4 to 6 s, the horizontal line shows constant velocity at 8 m/s, so acceleration is zero. From 6 to 8 s, velocity falls steadily to zero: the object decelerates.
A steeper line represents a greater magnitude of acceleration, provided the axis scales are the same. A straight sloping line has constant acceleration because equal time intervals produce equal changes in velocity. A curved line has changing acceleration because its gradient changes along the curve.
A horizontal line at zero velocity represents an object at rest. A horizontal line above zero represents an object moving at constant velocity.
Choose two well-separated points on the same straight section. A gradient triangle makes the vertical change in velocity and horizontal change in time clear. Divide the vertical change by the horizontal change:
On the first section of the graph, the points and give:
This means velocity increases by 2 m/s each second.
On the final section, use and :
The negative gradient means velocity is decreasing. Here the object is moving in the positive direction and slowing down, so its deceleration has a magnitude of 4 m/s². The final section is steeper than the first and represents a faster change in velocity.
The area between a velocity-time line and the time axis gives displacement. When the object does not reverse direction and velocity is positive, this also gives the distance travelled.
The connection is easiest to see for constant velocity. Travelling at 8 m/s for 2 s covers 16 m. On the graph, this motion forms a rectangle with height 8 m/s and width 2 s. Its area is m: velocity multiplied by time has units of distance.
For straight sections, divide the area into rectangles and triangles:
For the whole journey, the enclosed area consists of:
The total distance is m. All velocities are non-negative, so the displacement is also 40 m in the positive direction.
If a graph goes below the time axis, velocity is negative and the object is moving in the opposite direction. For displacement, areas below the axis count as negative. For total distance, add the magnitudes of all areas instead.
A curved graph cannot usually be divided exactly into a few triangles and rectangles. You can estimate its area using the graph's grid.
First calculate what one grid square represents, using its width on the time axis and its height on the velocity axis. Then count the complete squares between the curve and the time axis, combining partial squares to estimate additional whole squares. Multiply the estimated number of squares by the distance represented by each square.
For example, if each square spans 100 s horizontally and 5 m/s vertically, each represents m. An estimated enclosed area of 17 squares would therefore represent m. This is an estimate because judging the partial squares introduces uncertainty.
Get unlimited access to all revision notes, key terms, and exam tips.
Time on the horizontal axis; velocity on the vertical axis. Label units, choose even scales, plot time–velocity pairs and draw a line or curve representing the trend.
Get unlimited access to all revision notes, key terms, and exam tips.
For a gradient, use changes in both coordinates: (final velocity − initial velocity) ÷ (final time − initial time).
Use a large gradient triangle on a straight section and show which coordinates you have read.
A horizontal velocity-time line means zero acceleration, not necessarily that the object is stationary.
For area calculations, use the time-axis scale and velocity-axis scale. A counted square represents a distance, not simply ‘one metre’.
Keep units distinct: gradient gives acceleration in m/s²; area gives displacement or distance in m.
Velocity
Speed in a specified direction, measured in metres per second (m/s).
Acceleration
The rate of change of velocity, measured in metres per second squared (m/s²).
Gradient
The change in the vertical coordinate divided by the corresponding change in the horizontal coordinate. On a velocity-time graph, gradient represents acceleration.
Deceleration
A decrease in speed.
Distance
The total length of the path travelled by an object, measured in metres (m).
Displacement
The change in position of an object in a specified direction, measured in metres (m).
Put your knowledge into practice — try past paper questions for Combined Science Trilogy
Velocity
Speed in a specified direction, measured in metres per second (m/s).
Acceleration
The rate of change of velocity, measured in metres per second squared (m/s²).
Gradient
The change in the vertical coordinate divided by the corresponding change in the horizontal coordinate. On a velocity-time graph, gradient represents acceleration.
Deceleration
A decrease in speed.
Distance
The total length of the path travelled by an object, measured in metres (m).
Displacement
The change in position of an object in a specified direction, measured in metres (m).