

Loading…
Loading…
Loading…
OCR GCSE Combined Science B · J260
OCR J260 · Radioactive Decay and Half-Life Check the specification (PDF) (opens in a new tab)
An unstable atomic nucleus can emit radiation and become more stable. This change is called radioactive decay. Decay is random: we cannot predict exactly when any particular nucleus will decay.
That does not mean a large radioactive sample behaves without a pattern. Although individual decays are unpredictable, the overall rate of decay in a sample containing very many unstable nuclei can be predicted. As nuclei decay, fewer undecayed unstable nuclei remain, so the rate of further decays decreases.
The activity of a sample is the number of nuclear decays occurring per second. It is measured in becquerels, Bq: an activity of 800 Bq means that 800 nuclei decay each second. As the number of undecayed unstable nuclei falls, the activity falls too.
The half-life of a radioactive isotope is the time taken for half the unstable nuclei in a sample to decay. It is also the time taken for the activity of the sample to fall to half its starting value.
A particular isotope has a constant half-life. Each half-life halves what is still undecayed, rather than removing half the original sample every time. After one half-life, half the original unstable nuclei remain. After two half-lives, half of that half remains: one quarter of the original number. After three, one eighth remains.
This is a prediction about the behaviour of a large sample, not a timetable for individual nuclei. A particular nucleus might decay almost immediately or remain undecayed through several half-lives. Half-life does not tell us which nuclei will decay next.
An activity–time graph shows time on the horizontal axis and activity on the vertical axis. The curve falls steeply at first, when many unstable nuclei remain, then becomes less steep as the activity decreases. Equal time intervals produce equal proportional decreases, not equal numerical decreases.
Suppose a sample starts with an activity of 800 Bq and has a half-life of 5 minutes. Its predicted activity follows this pattern:
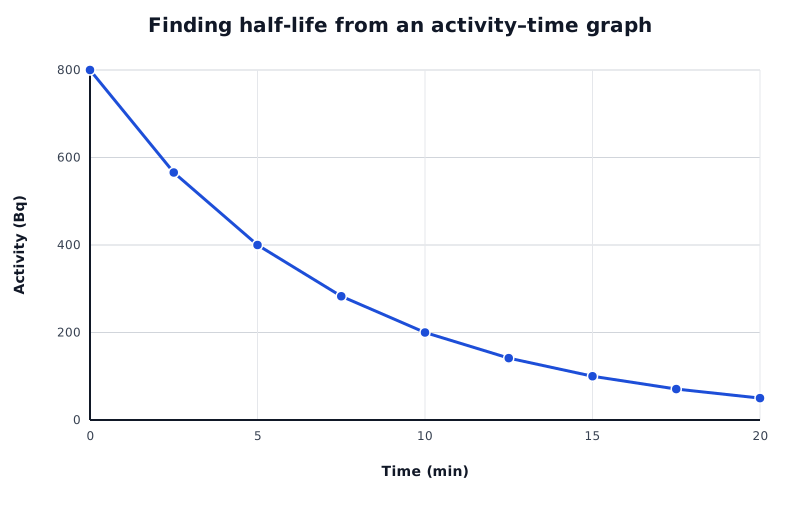
A constructed example: activity halves every 5 minutes, while the numerical decrease becomes smaller each time.
Data for Finding half-life from an activity–time graph
| Series | Time (min) | Activity (Bq) |
|---|---|---|
| Sample activity | 0 | 800 |
| Sample activity | 2.5 | 565.69 |
| Sample activity | 5 | 400 |
| Sample activity | 7.5 | 282.84 |
| Sample activity | 10 | 200 |
| Sample activity | 12.5 | 141.42 |
| Sample activity | 15 | 100 |
| Sample activity | 17.5 | 70.71 |
| Sample activity | 20 | 50 |
To find the half-life from the graph, start at 800 Bq on the activity axis and halve it to 400 Bq. Draw or trace a horizontal line from 400 Bq to the curve, then a vertical line down to the time axis. The activity reaches 400 Bq at 5 minutes, so the half-life is 5 minutes.
You can check using a different pair of activities. The activity falls from 400 Bq at 5 minutes to 200 Bq at 10 minutes. The elapsed time is minutes: the same half-life. It then takes another 5 minutes to fall from 200 Bq to 100 Bq.
The successive decreases are 400 Bq, 200 Bq and 100 Bq. They become smaller, even though each decrease takes the same time. This is why the graph is a curve rather than a straight line.
For a whole number of half-lives, repeatedly divide the initial activity by two. If is the number of half-lives, then:
The net decline is the amount by which the activity has decreased. First find the remaining activity, then subtract it from the initial activity:
To express that decline relative to the initial activity:
In the graph example, 15 minutes is three half-lives. The activity falls through Bq. The net decline is therefore Bq.
The ratio net decline : initial activity is , which simplifies to . In other words, seven eighths of the initial activity has been lost. By contrast, the ratio remaining activity : initial activity is . These describe the lost and remaining portions of the same starting activity.
After half-lives:
Distinguish the fraction remaining from the net decline: after three half-lives, 1/8 remains but 7/8 has been lost.
Label the order of a ratio. A net decline : initial activity ratio of 7:8 is different from a remaining : initial activity ratio of 1:8.
When finding half-life from two points on a graph, subtract their times. The later time alone is not necessarily the half-life.
Half-life concerns the nuclei that have not yet decayed, not half of all the atoms originally present disappearing.
It can see this note and what your specification asks for.
Answers are free with an account.
1 free note left this week
Get more free notesYour answer sets when this note comes back for review, or marks it complete.
Was this note helpful?
Log in to tell us whether it helped, or to report a problem.
Last updated
Radioactive decay
The random process in which an unstable atomic nucleus emits radiation and becomes more stable.
Activity
The number of nuclear decays in a radioactive sample per second, measured in becquerels (Bq).
Becquerel
The unit of activity: an activity of 1 Bq means one nuclear decay per second.
Half-life
The time taken for half the unstable nuclei in a sample to decay, or for the sample's activity to fall to half its starting value.
Net decline
The overall decrease in a quantity: its initial value minus its final value. For radioactive emission, the fractional net decline is the decrease in activity divided by the initial activity.
Put your knowledge into practice — try past paper questions for Combined Science B
Radioactive decay
The random process in which an unstable atomic nucleus emits radiation and becomes more stable.
Activity
The number of nuclear decays in a radioactive sample per second, measured in becquerels (Bq).
Becquerel
The unit of activity: an activity of 1 Bq means one nuclear decay per second.
Half-life
The time taken for half the unstable nuclei in a sample to decay, or for the sample's activity to fall to half its starting value.
Net decline
The overall decrease in a quantity: its initial value minus its final value. For radioactive emission, the fractional net decline is the decrease in activity divided by the initial activity.
Net decline : initial activity is .
Choose an activity and half that value. Read the time at each value and subtract:
Check another pair of halving values. The elapsed time should be the same.