

Loading…
Loading…
Loading…
OCR GCSE Combined Science B · J260
OCR J260 · Motion Graphs and Equations Check the specification (PDF) (opens in a new tab)
A motion graph shows how one quantity changes as time passes. Time goes on the horizontal axis. The vertical axis might show distance, speed or velocity, so its label determines how you interpret the graph.
Distance is the total length of the route travelled. Speed tells you how quickly that distance is covered. Velocity also includes direction: on a straight-line journey, positive and negative velocities represent motion in opposite directions.
A motion graph is not a drawing of the route. An upward-sloping line does not mean that an object is travelling uphill.
To draw a graph from measurements, label both axes with the quantity and unit, choose evenly spaced scales that use the available space, and plot each pair of values accurately. Join points with straight sections when the motion has constant speed between them. If the speed changes smoothly, draw a smooth curve rather than a zigzag.
Suppose an object travels 8 m in the first 4 s, remains still until 7 s, then travels another 12 m by 10 s. Its total-distance readings are 0 m at 0 s, 8 m at 4 s, 8 m at 7 s and 20 m at 10 s.
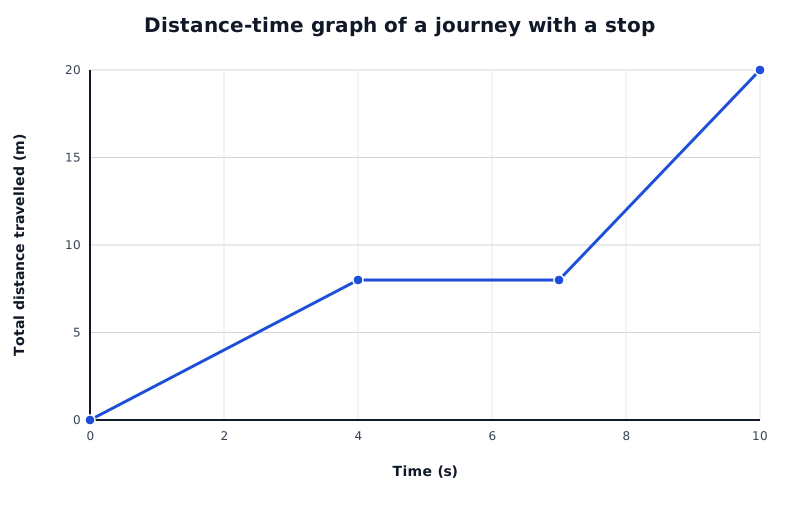
A constructed journey: constant speed, a stop, then a greater constant speed. The vertical axis shows total distance travelled.
Data for Distance-time graph of a journey with a stop
| Series | Time (s) | Total distance travelled (m) |
|---|---|---|
| Total distance travelled | 0 | 0 |
| Total distance travelled | 4 | 8 |
| Total distance travelled | 7 | 8 |
| Total distance travelled | 10 | 20 |
The first section rises steadily because the object covers equal distances in equal times: it has constant speed. The middle section is horizontal because time passes without any further distance being travelled. The final section is steeper, showing a greater speed.
The gradient measures how much extra distance is travelled per second:
Choose two well-separated points on a straight section and draw a right-angled gradient triangle between them. Its vertical side gives the change in distance; its horizontal side gives the elapsed time.
For the first section, the speed is . For the final section, use the changes in the readings: . The stationary section has zero gradient and therefore zero speed.
On a distance-time graph, a curve that becomes progressively steeper shows increasing speed. A curve that becomes less steep shows decreasing speed.
To estimate the speed at one instant, draw a tangent at the chosen point. Place a ruler so that its line follows the direction of the curve at that point, then extend the tangent. Draw a large gradient triangle on the tangent and calculate its gradient. Using two widely separated points on the curve itself would instead give an average speed over that interval.
Check what “distance” means on a particular graph. Total distance travelled cannot decrease, even when an object turns back. A graph of distance from a starting point can decrease as the object returns towards that point. A displacement-time graph includes direction, and its gradient gives velocity rather than speed.
On a speed-time graph, the height of the line tells you the speed at that instant. A horizontal line above zero means constant speed; a line on zero means stationary. A rising line shows increasing speed and a falling line shows decreasing speed.
For straight-line motion in one direction, the same graph can represent velocity against time. Suppose a trolley starts from rest, reaches 8 m/s after 4 s, maintains that velocity until 7 s, then slows uniformly to rest at 11 s. Plot the time–velocity pairs and join them with straight lines because each stage has constant acceleration or constant velocity.
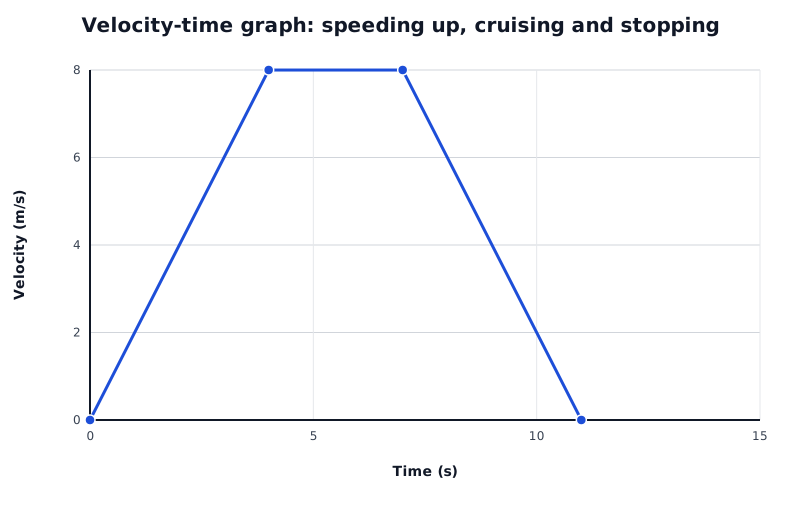
A constructed trolley journey. Gradients give acceleration; the two triangular areas and the rectangular area give the total distance travelled.
Data for Velocity-time graph: speeding up, cruising and stopping
| Series | Time (s) | Velocity (m/s) |
|---|---|---|
| Trolley velocity | 0 | 0 |
| Trolley velocity | 4 | 8 |
| Trolley velocity | 7 | 8 |
| Trolley velocity | 11 | 0 |
From 0 to 4 s, velocity rises steadily. From 4 to 7 s, it is constant. From 7 to 11 s, it falls steadily to zero.
On a velocity-time graph, gradient gives acceleration:
The first section has acceleration . The horizontal section has zero acceleration. The final section has acceleration : the positive velocity is decreasing, so the trolley is slowing down.
A steeper gradient means a greater magnitude of acceleration. A straight sloping line means constant acceleration; a curved line means changing acceleration. To find acceleration at a point on a curved velocity-time graph, calculate the gradient of a tangent there.
Negative velocity means motion in the chosen negative direction. It does not, by itself, mean slowing down. To decide whether an object is speeding up or slowing down, check whether its velocity is moving away from or towards zero.
The enclosed area between a velocity-time line and the time axis represents displacement. When velocity stays positive, this is also the distance travelled. On a speed-time graph, the area always gives distance travelled.
This follows from distance being speed multiplied by time. For constant velocity, the area is a rectangle: its height is velocity and its width is time. The units multiply to give metres: .
For the trolley journey, split the area into a triangle, a rectangle and another triangle:
The total distance is . The trolley covers distance while speeding up and while slowing down, not just while travelling at constant velocity.
For more complicated straight-line graphs, divide the area into rectangles and triangles and add their areas. For a curved graph, estimate the area by counting grid squares, combining partial squares, and multiplying by the distance represented by one square.
If a velocity-time graph extends below the time axis, areas below it count negatively when finding displacement. To find total distance travelled, add the magnitudes of the areas above and below the axis instead.
Check the vertical-axis label first: a distance-time gradient gives speed; a velocity-time gradient gives acceleration.
Use a large gradient triangle and calculate changes in the axis values, not just the coordinates of one point.
Read the scales carefully. Convert distances to metres and times to seconds when an answer is needed in m/s or m/s².
A horizontal velocity-time line does not necessarily mean stationary: it means constant velocity. The object is stationary only if its velocity is zero.
For an area calculation, use the duration of each section as its base, rather than its finishing time.
It can see this note and what your specification asks for.
Answers are free with an account.
1 free note left this week
Get more free notesYour answer sets when this note comes back for review, or marks it complete.
Was this note helpful?
Log in to tell us whether it helped, or to report a problem.
Last updated
Distance-time graph
A graph showing how an object's distance travelled changes with time. Its gradient gives speed.
Speed-time graph
A graph showing how an object's speed changes with time. Its gradient gives the rate of change of speed.
Velocity-time graph
A graph showing how an object's velocity changes with time. Its gradient gives acceleration and its signed area gives displacement.
Gradient
The slope of a graph, calculated as the change in the vertical-axis quantity divided by the change in the horizontal-axis quantity.
Tangent
A straight line that touches a curve at a chosen point and has the same slope as the curve there.
Acceleration
The rate of change of velocity, measured in m/s².
Put your knowledge into practice — try past paper questions for Combined Science B
Distance-time graph
A graph showing how an object's distance travelled changes with time. Its gradient gives speed.
Speed-time graph
A graph showing how an object's speed changes with time. Its gradient gives the rate of change of speed.
Velocity-time graph
A graph showing how an object's velocity changes with time. Its gradient gives acceleration and its signed area gives displacement.
Gradient
The slope of a graph, calculated as the change in the vertical-axis quantity divided by the change in the horizontal-axis quantity.
Tangent
A straight line that touches a curve at a chosen point and has the same slope as the curve there.
Acceleration
The rate of change of velocity, measured in m/s².
Time on the horizontal axis; label quantities and units, use regular scales and plot accurately. Use straight sections for constant speed or constant acceleration as appropriate, and smooth curves for smoothly changing motion.