

Loading…
Loading…
Loading…
OCR GCSE Combined Science B · J260
OCR J260 · Climate Change Impacts and Mitigation Check the specification (PDF) (opens in a new tab)
Earth receives energy from the Sun as electromagnetic radiation. Some incoming radiation is reflected back into space by clouds, the atmosphere and bright surfaces. Some passes through the atmosphere and is absorbed by Earth’s surface, transferring energy to it and warming it.
The warm surface then emits infrared radiation. Some infrared radiation passes through the atmosphere into space, but some is absorbed by greenhouse gases, including carbon dioxide and methane. These gases emit infrared radiation in all directions, including downwards towards Earth’s surface. This keeps the surface and lower atmosphere warmer than they would otherwise be: the greenhouse effect.
The important distinction is between incoming solar radiation and outgoing infrared radiation. Greenhouse gases do not simply reflect all radiation back to Earth: they absorb and emit infrared radiation.
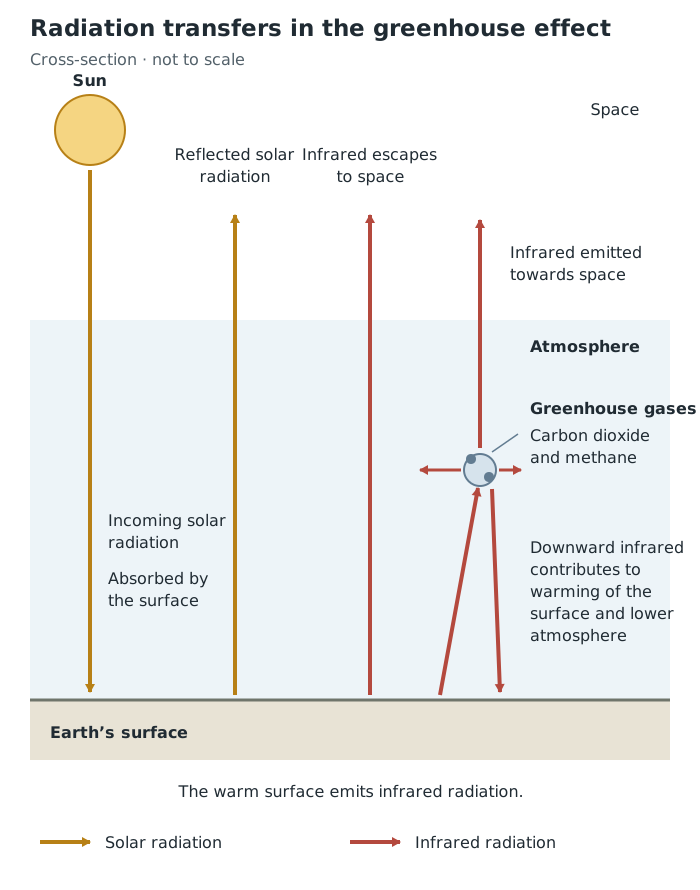
Greenhouse gases absorb outgoing infrared radiation and emit infrared in all directions, including towards Earth’s surface.
The natural greenhouse effect makes Earth warm enough for life as we know it. Adding more greenhouse gases enhances this effect. Initially, less energy escapes to space than enters from the Sun, so Earth gains energy and warms until incoming and outgoing energy balance again at a higher temperature.
Carbon dioxide is naturally exchanged between the atmosphere, living organisms and oceans. Plants remove it during photosynthesis; respiration and decomposition return it. Its natural presence does not mean that adding more has no effect.
Burning coal, oil and natural gas transfers carbon that was stored underground into the atmosphere as carbon dioxide. Natural removal processes do not remove all this additional carbon dioxide as quickly as it is added, so some accumulates in the atmosphere. Deforestation also contributes: it can release carbon stored in vegetation and leaves fewer trees to remove carbon dioxide through photosynthesis.
Anthropogenic climate change means climate change caused by human activities. The issue is not whether climate can change naturally—it can—but whether natural influences alone explain recent warming.
Atmospheric carbon dioxide has increased as fossil fuel consumption has grown. By 2019, its concentration was more than 40% above its nineteenth-century level. Most of this increase occurred after 1970, around the time global energy consumption accelerated. This supports a link between fossil fuel use and rising atmospheric carbon dioxide.
There is also a long-term association between rising greenhouse gas concentrations and rising global surface temperature. These relationships are correlations: quantities change together. Correlation alone cannot establish a cause, because other factors could influence the quantities being compared.
The causal explanation is stronger when several independent lines of evidence agree:
Natural influences include changes in the Sun’s output, volcanic eruptions and natural fluctuations within the climate system. Simulations using only natural influences produce little warming, or slight cooling, over the twentieth century and into the twenty-first. Including human influences gives results consistent with the observed warming. The overall evidence therefore supports human activities as the main cause of recent climate change, rather than merely showing two rising lines.
A concentration tells us how much carbon dioxide is present in the air, not how much is emitted each year. Parts per million, or ppm, expresses this concentration: 316 ppm means 316 carbon dioxide molecules per million molecules of air.
The Mauna Loa Observatory in Hawaii provides a long-running atmospheric carbon dioxide record:
| Year | Average atmospheric carbon dioxide concentration |
|---|---|
| 1959 | 316 ppm |
| 2019 | More than 411 ppm |
Read the column headings before comparing the entries. These are concentrations at the same observatory in two different years. The rise was more than 95 ppm. That is an absolute change in concentration, not a 95% increase. A percentage change compares the increase with the starting value:
The entries show an increase of more than 30% between 1959 and 2019. This differs from the more-than-40% increase since the nineteenth century because the starting date is different.
When interpreting a time-series graph, first identify the time axis, the measured quantity, its units and the key. Then read values using the spacing of the scale. A vertical axis need not begin at zero, so the apparent steepness or size of a rise is not a substitute for reading the numbers.
The Mauna Loa carbon dioxide record has small seasonal rises and falls superimposed on a sustained upward trend. These seasonal fluctuations reflect changes in carbon dioxide uptake and release by plants. Compare equivalent seasons or annual averages when judging the long-term change; a short seasonal fall does not contradict the overall rise.
The South Pole record also rises over the same period. Agreement between these distant stations makes a purely local explanation less plausible. Remote monitoring sites are useful because their readings are less affected by nearby processes and better represent the background atmosphere.
For a graph or table comparing fossil fuel use with carbon dioxide concentration, compare changes over the same time interval. Identify whether both increase, whether their rates of increase change, and any departures from the pattern. Two quantities can be correlated without increasing by identical percentages. If separate vertical scales are used, compare the numerical values rather than the lines’ heights.
Modern instruments measure atmospheric carbon dioxide accurately, but historical records have limitations. Earlier temperature measurements covered fewer places and used different instruments and methods. Scientists also reconstruct past conditions indirectly, for example by analysing gases trapped in ice. Such evidence extends the record far beyond direct measurements, but its interpretation and dating introduce uncertainties.
Climate itself is complex. Natural fluctuations can temporarily strengthen or weaken a warming trend, and climate models simplify interacting processes. These limitations affect the precision of estimates, particularly the timing and size of future changes and changes in individual regions.
An evaluation should therefore consider measurement quality, geographical coverage, the length of the record and whether independent evidence agrees. A short record from one place gives weaker evidence about global climate than a long record supported by measurements from many places.
Uncertainty does not mean that all explanations are equally likely. The agreement between radiation physics, measurements, carbon fingerprints and model comparisons makes the conclusion that humans are driving recent warming much stronger than any single correlation. The exact amount and pattern of future change remain less certain than the existence of the greenhouse effect and the human contribution to recent warming.
Orders of magnitude compare scale using powers of ten. A factor of about 10 is one order of magnitude; a factor of about 100 is two.
For example, the carbon dioxide emission rate from volcanoes is roughly 1% of that from fossil fuel combustion. Comparing the same quantity over the same time interval, fossil fuel emissions are therefore about 100 times larger—two orders of magnitude larger. This helps assess whether volcanic emissions are a plausible explanation for the additional carbon dioxide from human activities.
Always put quantities into comparable units before taking a ratio. An emission rate cannot be directly compared with an atmospheric concentration: one describes how quickly carbon dioxide is added, while the other describes how much is present. A small-looking concentration can still be important if it changes the balance of radiation entering and leaving Earth.
Solar radiation is absorbed by Earth’s surface → surface warms and emits infrared radiation → carbon dioxide and methane absorb infrared and emit it in all directions, including downwards.
More greenhouse gas → initially less energy escapes → warming until energy balance is restored.
Explain the greenhouse effect using absorption and re-emission of infrared radiation, not just the phrase ‘traps heat’.
A correlation supports a possible link but does not establish causation by itself. Combine it with a mechanism and independent evidence.
Support a data interpretation with values, dates and units. Distinguish seasonal fluctuations from a long-term trend.
Check whether data show atmospheric concentration or emissions per year: these are different quantities.
One order of magnitude means a factor of about 10, not an increase of 10 units.
It can see this note and what your specification asks for.
Answers are free with an account.
1 free note left this week
Get more free notesYour answer sets when this note comes back for review, or marks it complete.
Was this note helpful?
Log in to tell us whether it helped, or to report a problem.
Last updated
Greenhouse effect
The warming of Earth’s surface and lower atmosphere because greenhouse gases absorb outgoing infrared radiation and emit infrared radiation in all directions, including towards the surface.
Greenhouse gas
An atmospheric gas that absorbs and emits infrared radiation, such as carbon dioxide or methane.
Infrared radiation
Electromagnetic radiation emitted by Earth’s warm surface and absorbed by greenhouse gases.
Climate change
A long-term change in climate, including average temperatures and weather patterns.
Anthropogenic
Caused by human activities.
Fossil fuel
Coal, oil or natural gas formed from ancient organic material; burning these fuels releases stored carbon as carbon dioxide.
Correlation
A relationship in which two measured quantities tend to change together. It does not, on its own, establish that one causes the other.
Parts per million (ppm)
A unit of concentration. For atmospheric gases, 316 ppm means 316 molecules of that gas per million molecules of air.
Order of magnitude
A power-of-ten description of scale. Quantities differing by two orders of magnitude differ by a factor of about 100.
Put your knowledge into practice — try past paper questions for Combined Science B
Greenhouse effect
The warming of Earth’s surface and lower atmosphere because greenhouse gases absorb outgoing infrared radiation and emit infrared radiation in all directions, including towards the surface.
Greenhouse gas
An atmospheric gas that absorbs and emits infrared radiation, such as carbon dioxide or methane.
Infrared radiation
Electromagnetic radiation emitted by Earth’s warm surface and absorbed by greenhouse gases.
Climate change
A long-term change in climate, including average temperatures and weather patterns.
Anthropogenic
Caused by human activities.
Fossil fuel
Coal, oil or natural gas formed from ancient organic material; burning these fuels releases stored carbon as carbon dioxide.
Correlation
A relationship in which two measured quantities tend to change together. It does not, on its own, establish that one causes the other.
Parts per million (ppm)
A unit of concentration. For atmospheric gases, 316 ppm means 316 molecules of that gas per million molecules of air.
Order of magnitude
A power-of-ten description of scale. Quantities differing by two orders of magnitude differ by a factor of about 100.
Correlation alone is insufficient; independent evidence strengthens causation.
Historical measurements have limited coverage and variable methods. Indirect records require interpretation. Natural variability and model simplifications limit precision, especially for regional and future changes. These uncertainties do not overturn the combined evidence for human-caused warming.
Check axes, headings, units, keys, scales and time intervals. Separate seasonal fluctuations from long-term trends.
Distinguish concentration from emission rate, and absolute change from percentage change.
One order of magnitude ≈ factor 10; two ≈ factor 100. Compare like quantities in matching units.