

Loading…
Loading…
Loading…
Eduqas GCSE Sociology · C200
Eduqas C200 Check the specification (PDF) (opens in a new tab)
Sociologists use data to investigate social life, including education, families, employment and crime. is numerical information, such as the number of people in a category or the percentage giving a particular answer. Graphs, charts and tables organise this information so that comparisons become easier to see. Diagrams can also show relationships or processes rather than numerical amounts.
When a sociologist uses information already collected by someone else, it is secondary data. Interpreting it involves more than reading individual figures: the researcher looks for patterns, describes changes and decides what conclusions the evidence supports.
A pattern is a recurring relationship in the data, such as one group consistently having a higher employment rate than another. A trend is the general direction of change over time. Values might rise, fall, remain broadly stable or fluctuate up and down.
Start with the title, labels and any key. Identify who or what is being studied, where the data comes from and which dates it covers. A table about adults in one town is not automatically evidence about all adults in the UK.
Check the units carefully. A count tells you how many people are recorded; a percentage tells you the proportion of a group. Larger groups can produce larger counts without having larger proportions. For example, 40 pupils out of 100 is a smaller proportion than 30 pupils out of 50, despite being a larger number of pupils.
On a graph, the horizontal axis is the x-axis and the vertical axis is the y-axis. Read their labels rather than assuming what they represent. Check the scale intervals and whether the vertical scale starts at zero. A shortened vertical scale can make a modest difference look dramatic. In a table, read the row and column headings together to locate the correct figure, and check any notes explaining categories or units.
Suppose a published study compared the percentage of pupils attending a school club in two UK schools. These constructed figures let us practise interpreting the same information in different formats.
| Year | School A: pupils attending (%) | School B: pupils attending (%) |
|---|---|---|
| 2021 | 40 | 30 |
| 2023 | 50 | 45 |
| 2025 | 60 | 55 |
To find School B's figure for 2023, follow the 2023 row across to School B's column: it is 45%. To compare schools in a particular year, read across a row. To examine change within a school, read down its column.
A line graph makes change over time easier to follow. Time usually runs along the horizontal axis; the vertical axis shows the measured quantity. Where there is more than one line, use the key to keep the groups separate.
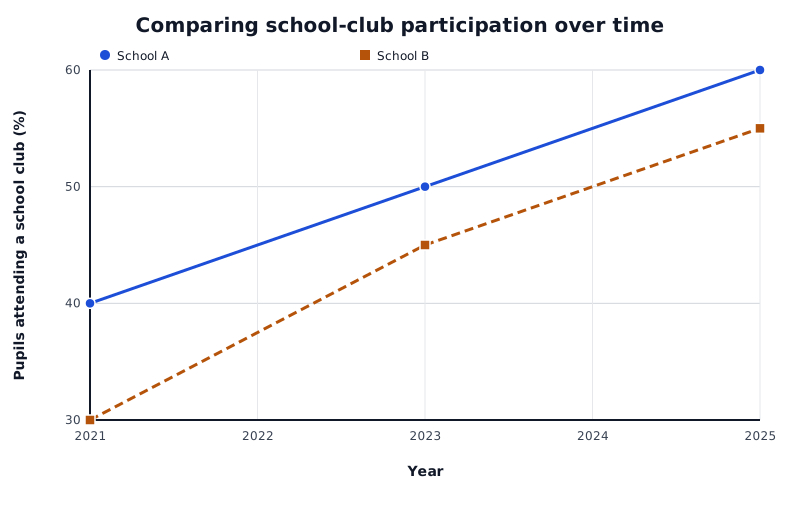
Constructed figures for two UK schools: participation rises in both, while the gap between them narrows.
Data for Comparing school-club participation over time
| Series | Year | Pupils attending a school club (%) |
|---|---|---|
| School A | 2021 | 40 |
| School A | 2023 | 50 |
| School A | 2025 | 60 |
| School B | 2021 | 30 |
| School B | 2023 | 45 |
| School B | 2025 | 55 |
Three conclusions are supported here. First, participation increased in both schools between 2021 and 2025. Second, School A had higher participation at every recorded date. Third, the gap narrowed: it was 10 percentage points in 2021 but 5 percentage points in 2025.
School B also had the larger overall increase: 25 percentage points, compared with 20 in School A. This shows why the highest final value and the greatest increase are different findings. The graph does not establish what happened between the recorded dates or whether the rise will continue.
A bar chart compares separate categories, such as survey answers or family types. The bars have gaps between them. Category labels usually appear on the horizontal axis, while bar height represents a number, percentage or other labelled measure. Use the key when several bars represent different groups within each category.
Read bar heights against the scale, then identify the largest and smallest categories and any important differences. If two groups have different sizes, percentages may offer a more meaningful comparison than raw counts.
A pie chart shows how a whole is divided into categories. Each sector represents a share of that whole; a larger sector represents a larger share. The complete circle represents 100%.
For example, suppose a survey of 100 pupils records 50 walking to school, 30 travelling by bus and 20 travelling by car. In a bar chart, walking would have the tallest bar. In a pie chart, walking would occupy half the circle, bus travel 30% and car travel 20%. Both displays show that walking is the most common category, but the pie chart particularly emphasises each category's share of the total.
When comparing two pie charts, check their totals. Equal-sized sectors mean equal proportions, not necessarily equal numbers of people.
Diagrams may represent connections rather than amounts. Read their labels and key to establish what boxes, lines, arrows or symbols mean. An arrow might show a sequence, a direction of influence or a relationship reported by a participant; its meaning depends on the diagram.
For example, suppose a friendship diagram uses an arrow from one pupil to another to mean ‘named this person as a friend’. Arrows in both directions indicate that both pupils named each other. A pupil receiving several arrows was named by several others. A pupil receiving none was not named within the recorded responses—not necessarily someone with no friends outside the study.
The method is to identify the relationship shown, look for clusters or exceptions, and describe only what those connections establish. The same care applies to flow charts: following a sequence of boxes shows the process represented, but does not tell you how often it occurs unless figures are included.
A useful interpretation combines a clear statement with relevant evidence: ‘Participation increased in School A from 40% in 2021 to 60% in 2025.’ Look for exceptions as well as the overall pattern. An unusual value, or anomaly, may deserve investigation rather than being ignored or automatically treated as an error.
Separate description from explanation. The school figures show rising participation, but they do not prove why it rose. More clubs, changing pupil preferences or other factors could be investigated. Similarly, an association between two variables—a correlation—does not by itself establish cause and effect.
Finally, consider the scope of the evidence. A small or unrepresentative sample may not support conclusions about a wider population. A short time period may not reveal a lasting trend. Changes in definitions or collection methods can also make comparisons less secure. These limitations qualify a conclusion; they do not mean that every finding must be dismissed.
Check title → population and dates → labels and key → units and scale. Read table values using both row and column headings.
Counts and proportions are different. Subtract percentages to find a difference in percentage points. Equal pie-chart proportions need not represent equal counts.
State the finding and support it with figures, groups, dates and units. Check sample coverage, time period and consistent definitions. An association does not prove causation; an observed trend does not guarantee future change.
Support each pattern or trend with relevant figures, including the groups, dates and units.
Compare changes, not just final values: the group with the highest final value may not have increased the most.
Check whether figures are numbers, percentages or rates before comparing them. A difference between two percentages is measured in percentage points.
Keep conclusions within the evidence: a pattern does not by itself prove its cause or show that it applies to the whole UK population.
It can see this note and what your specification asks for.
Answers are free with an account.
1 free note left this week
Get more free notesYour answer sets when this note comes back for review, or marks it complete.
Was this note helpful?
Log in to tell us whether it helped, or to report a problem.
Last updated
Quantitative data
Numerical information, such as counts, percentages or rates, which can be compared and analysed.
Secondary data
Information already collected by someone else and subsequently used by a researcher.
Pattern
A recurring relationship or arrangement in data, such as one group consistently having higher values than another.
Trend
The general direction of change in data over time, such as an increase, decrease or fluctuation.
Anomaly
A value or observation that differs from the general pattern and may need further investigation.
Percentage point
A unit used to describe the difference between percentages. A rise from 30% to 40% is an increase of 10 percentage points.
Correlation
An association between variables: they vary together, but this does not necessarily mean that one causes the other.
Put your knowledge into practice — try past paper questions for Sociology
Quantitative data
Numerical information, such as counts, percentages or rates, which can be compared and analysed.
Secondary data
Information already collected by someone else and subsequently used by a researcher.
Pattern
A recurring relationship or arrangement in data, such as one group consistently having higher values than another.
Trend
The general direction of change in data over time, such as an increase, decrease or fluctuation.
Anomaly
A value or observation that differs from the general pattern and may need further investigation.
Percentage point
A unit used to describe the difference between percentages. A rise from 30% to 40% is an increase of 10 percentage points.
Correlation
An association between variables: they vary together, but this does not necessarily mean that one causes the other.